HSBC 2001 Annual Report Download - page 194
Download and view the complete annual report
Please find page 194 of the 2001 HSBC annual report below. You can navigate through the pages in the report by either clicking on the pages listed below, or by using the keyword search tool below to find specific information within the annual report.-
 1
1 -
2
-
3
-
4
-
5
-
6
-
7
-
8
-
9
-
10
-
11
-
12
-
13
-
14
-
15
-
16
-
17
-
18
-
19
-
20
-
21
-
22
-
23
-
24
-
25
-
26
-
27
-
28
-
29
-
30
-
31
-
32
-
33
-
34
-
35
-
36
-
37
-
38
-
39
-
40
-
41
-
42
-
43
-
44
-
45
-
46
-
47
-
48
-
49
-
50
-
51
-
52
-
53
-
54
-
55
-
56
-
57
-
58
-
59
-
60
-
61
-
62
-
63
-
64
-
65
-
66
-
67
-
68
-
69
-
70
-
71
-
72
-
73
-
74
-
75
-
76
-
77
-
78
-
79
-
80
-
81
-
82
-
83
-
84
-
85
-
86
-
87
-
88
-
89
-
90
-
91
-
92
-
93
-
94
-
95
-
96
-
97
-
98
-
99
-
100
-
101
-
102
-
103
-
104
-
105
-
106
-
107
-
108
-
109
-
110
-
111
-
112
-
113
-
114
-
115
-
116
-
117
-
118
-
119
-
120
-
121
-
122
-
123
-
124
-
125
-
126
-
127
-
128
-
129
-
130
-
131
-
132
-
133
-
134
-
135
-
136
-
137
-
138
-
139
-
140
-
141
-
142
-
143
-
144
-
145
-
146
-
147
-
148
-
149
-
150
-
151
-
152
-
153
-
154
-
155
-
156
-
157
-
158
-
159
-
160
-
161
-
162
-
163
-
164
-
165
-
166
-
167
-
168
-
169
-
170
-
171
-
172
-
173
-
174
-
175
-
176
-
177
-
178
-
179
-
180
-
181
-
182
-
183
-
 184
184 -
 185
185 -
 186
186 -
 187
187 -
 188
188 -
 189
189 -
 190
190 -
 191
191 -
 192
192 -
 193
193 -
 194
194 -
 195
195 -
 196
196 -
 197
197 -
 198
198 -
 199
199 -
 200
200 -
 201
201 -
 202
202 -
 203
203 -
 204
204 -
205
-
206
-
207
-
208
-
209
-
210
-
211
-
212
-
213
-
214
-
215
-
216
-
217
-
218
-
219
-
220
-
221
-
222
-
223
-
224
-
225
-
226
-
227
-
228
-
229
-
230
-
231
-
232
-
233
-
234
-
235
-
236
-
237
-
238
-
239
-
240
-
241
-
242
-
243
-
244
-
245
-
246
-
247
-
248
-
249
-
250
-
251
-
252
-
253
-
254
-
255
-
256
-
257
-
258
-
259
-
260
-
261
-
262
-
263
-
264
-
265
-
266
-
267
-
268
-
269
-
270
-
271
-
272
-
273
-
274
-
275
-
276
-
277
-
278
-
279
-
280
-
281
-
282
-
283
-
284
 |
 |

HSBC HOLDINGS PLC
Notes on the Financial Statements (continued)
192
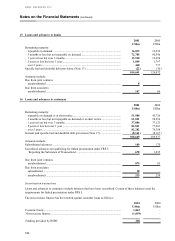
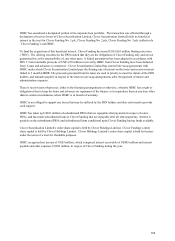
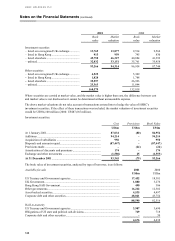
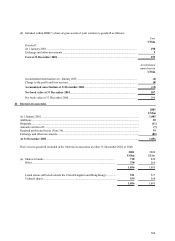
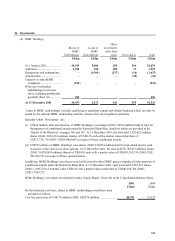
Proceeds from the sale of investment securities were US$1,796 million (2000: US$1,259 million). Gross realised
gains of US$290 million (2000: US$225 million) and gross realised losses of US$25 million (2000: US$20 million)
were recorded on those sales. Realised gains and losses are computed using the weighted average cost method.
There were no gains recorded on securities transferred from the investment book to the trading book.
The cost of investment securities purchased during the year ended 31 December 2001 was US$1,670 million (2000:
US$1,822 million).
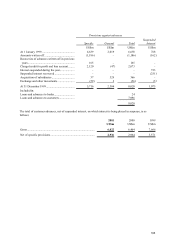
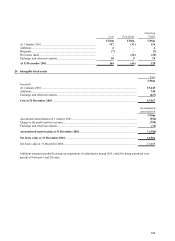
21 Interests in joint ventures
2001
US$m
At 1 January 2001................................................................................................................................... 283
Additions ................................................................................................................................................ 120
Amortisation of goodwill........................................................................................................................ (8)
Retained profits and losses (Note 36) ..................................................................................................... (78)
Exchange and other movements ............................................................................................................. (25)
At 31 December 2001............................................................................................................................ 292
2001 2000
US$m US$m
(a) Shares in banks................................................................................................... 51
–
Other ................................................................................................................... 241 283
292 283
All shares are unlisted.
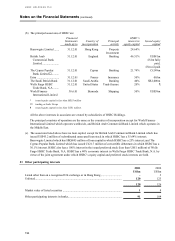
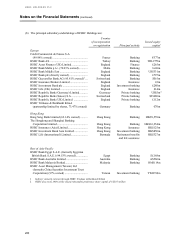
(b) The principal joint ventures of HSBC are:
Country o
f
incorporation
P
rincipa
l
activity
HSBC’s
interest in
equity
capita
l
I
ssue
d
equity
capita
l
Merrill Lynch HSBC Limited .................... England Commercial
banking
50% US$395m
Framlington Group Limited ....................... England Asset
management
51% £3m
Loxxia Slibail............................................. France Leasing 49% €32m
All of the above interests in joint ventures are owned by subsidiaries of HSBC Holdings. All of the above make
their financial statements up to 31 December.
The principal countries of operation are the same as the countries of incorporation, except for Merrill Lynch
HSBC Limited which operates in the UK, Australia and Canada.
(c) HSBC’ s share of total operating income in joint ventures is US$79 million (2000: US$29 million).
HSBC’ s share of contingent liabilities in joint ventures is US$56 million (2000: US$37 million). HSBC’ s share
of commitments by joint ventures is US$ nil (2000: US$98 million).