HSBC 2001 Annual Report Download - page 74
Download and view the complete annual report
Please find page 74 of the 2001 HSBC annual report below. You can navigate through the pages in the report by either clicking on the pages listed below, or by using the keyword search tool below to find specific information within the annual report.-
 1
1 -
2
-
3
-
4
-
5
-
6
-
7
-
8
-
9
-
10
-
11
-
12
-
13
-
14
-
15
-
16
-
17
-
18
-
19
-
20
-
21
-
22
-
23
-
24
-
25
-
26
-
27
-
28
-
29
-
30
-
31
-
32
-
33
-
34
-
35
-
36
-
37
-
38
-
39
-
40
-
41
-
42
-
43
-
44
-
45
-
46
-
47
-
48
-
49
-
50
-
51
-
52
-
53
-
54
-
55
-
56
-
57
-
58
-
59
-
60
-
61
-
62
-
63
-
 64
64 -
 65
65 -
 66
66 -
 67
67 -
 68
68 -
 69
69 -
 70
70 -
 71
71 -
 72
72 -
 73
73 -
 74
74 -
 75
75 -
 76
76 -
 77
77 -
 78
78 -
 79
79 -
 80
80 -
 81
81 -
 82
82 -
 83
83 -
 84
84 -
85
-
86
-
87
-
88
-
89
-
90
-
91
-
92
-
93
-
94
-
95
-
96
-
97
-
98
-
99
-
100
-
101
-
102
-
103
-
104
-
105
-
106
-
107
-
108
-
109
-
110
-
111
-
112
-
113
-
114
-
115
-
116
-
117
-
118
-
119
-
120
-
121
-
122
-
123
-
124
-
125
-
126
-
127
-
128
-
129
-
130
-
131
-
132
-
133
-
134
-
135
-
136
-
137
-
138
-
139
-
140
-
141
-
142
-
143
-
144
-
145
-
146
-
147
-
148
-
149
-
150
-
151
-
152
-
153
-
154
-
155
-
156
-
157
-
158
-
159
-
160
-
161
-
162
-
163
-
164
-
165
-
166
-
167
-
168
-
169
-
170
-
171
-
172
-
173
-
174
-
175
-
176
-
177
-
178
-
179
-
180
-
181
-
182
-
183
-
184
-
185
-
186
-
187
-
188
-
189
-
190
-
191
-
192
-
193
-
194
-
195
-
196
-
197
-
198
-
199
-
200
-
201
-
202
-
203
-
204
-
205
-
206
-
207
-
208
-
209
-
210
-
211
-
212
-
213
-
214
-
215
-
216
-
217
-
218
-
219
-
220
-
221
-
222
-
223
-
224
-
225
-
226
-
227
-
228
-
229
-
230
-
231
-
232
-
233
-
234
-
235
-
236
-
237
-
238
-
239
-
240
-
241
-
242
-
243
-
244
-
245
-
246
-
247
-
248
-
249
-
250
-
251
-
252
-
253
-
254
-
255
-
256
-
257
-
258
-
259
-
260
-
261
-
262
-
263
-
264
-
265
-
266
-
267
-
268
-
269
-
270
-
271
-
272
-
273
-
274
-
275
-
276
-
277
-
278
-
279
-
280
-
281
-
282
-
283
-
284
 |
 |

HSBC HOLDINGS PLC
Financial Review (continued)
72
of Banco CCF Brasil SA (‘CCF Brasil’ ). Funds
under management stood at US$10.8 billion as at
December 2000, compared with US$4.1 billion as at
the end of 1999. CCF Brasil contributed US$5.6
billion of this increase. In total, funds under
management by our Brazilian operations now rank
fourth largest in Brazil, as at June 2000, compared to
tenth at December 1999.
Operating expenses at US$1,648 million in 2000
were US$198 million higher than in 1999. Operating
expenses in Brazil were US$56 million higher than
in 1999. Cost increases reflected business growth
and restructuring to achieve operating efficiencies
and integrate CCF Brasil with HSBC’s existing
operations in Brazil. In Argentina, expenses rose by
US$55 million to US$445 million. Staff costs grew
by US$48 million as a result of a higher headcount
and an increase in average salaries and bonuses.
Controls were put in place to restrain operating
expense growth with a number of contracts
renegotiated in areas such as communications and
mailing and marketing campaigns. These initiatives
together with other one off impacts partially offset
the higher staff costs. The cost:income ratio
improved slightly to 73 per cent.
Provisions for bad and doubtful debts increased
by US$71 million compared with 1999. In Brazil,
there was a significant increase in provisioning
requirements in the second half of the year reflecting
changes in asset mix. Strong growth in the consumer
book brought with it a corresponding increase in
delinquencies and provisioning levels rose to reflect
the underlying risks within the consumer portfolio.
Provisioning on consumer lending was adequately
covered by the interest revenue earned on these
products and it is HSBC policy to make a full
provision for delinquent consumer credit after 180
days. In Argentina, provisions for bad and doubtful
debts in 2000 of US$56 million represented 2.1 per
cent of average loans and advances to customers and
were US$18 million lower than 1999 although still
impacted by the weak economic environment. Non-
performing loans at US$579 million were US$215
million higher than December 1999 reflecting the
weak economy.
Consistent with HSBC’s strong focus on capital
management, Brazil paid dividends and capital
repatriations of US$179 million during the year,
bringing total dividends and remitted capital since
December 1998 to US$373 million.
CCF Brasil made a small contribution to HSBC
pre-tax profits.
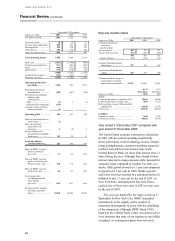
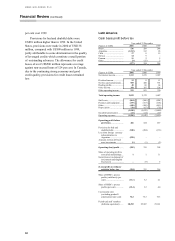
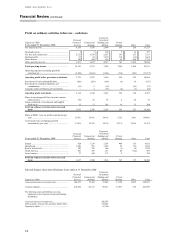
Analysis by line of business
The data presented on pages 73 and 74 reflects an
analysis of HSBC’s results and of certain key
balance sheet amounts, according to the lines of
business described on pages 20 to 24. This provides
additional and complementary analysis to HSBC’s
segmental reporting by geographic region.
The results are presented in accordance with the
accounting policies used in the preparation of
HSBC’s consolidated financial statements. HSBC’s
operations are closely integrated and, accordingly,
the presentation of line of business data includes
internal allocations of certain items of income and
expenses. These allocations include the costs of
certain support services and head office functions, to
the extent that these can be meaningfully attributed
to operational business lines. While such allocations
have been made on a systematic basis they
necessarily involve a degree of subjectivity.
Where relevant, income and expense amounts
presented include the results of inter-company and
inter-business line transactions. Such transactions are
generally undertaken on arm’s-length terms. Inter-
business line funding and placement of surplus funds
is generally undertaken at market interest rates.The
reported results of each line of business include the
funding benefit of the shareholders’ funds allocated
to that business. Shareholders’ funds are generally
allocated to lines of business on the basis of
economic capital measures including the relative risk
weighted assets of each operation.
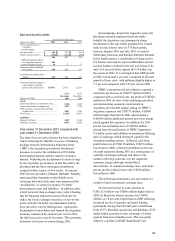
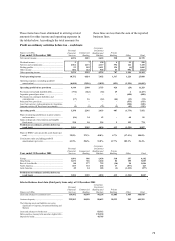
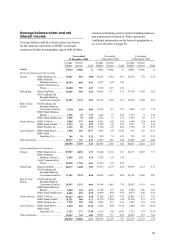
Key balance sheet data is presented below.
Comparative data for line of business reporting
is presented for 2000 only, as it is not practicable to
produce this data for 1999. The data previously
presented analysing HSBC’s performance between
commercial and investment banking is no longer
presented, as this does not reflect the way that HSBC
now analyses its business.
In the analysis of profit by line of business
which follows, total operating income and operating
expenses include intra-HSBC items of US$1,083
million in 2001 and US$940 million in 2000. These
amounts represent the other operating income and
expenses arising from inter-company transactions
within and between HSBC’s geographic regions.