HSBC 2001 Annual Report Download - page 40
Download and view the complete annual report
Please find page 40 of the 2001 HSBC annual report below. You can navigate through the pages in the report by either clicking on the pages listed below, or by using the keyword search tool below to find specific information within the annual report.-
 1
1 -
2
-
3
-
4
-
5
-
6
-
7
-
8
-
9
-
10
-
11
-
12
-
13
-
14
-
15
-
16
-
17
-
18
-
19
-
20
-
21
-
22
-
23
-
24
-
25
-
26
-
27
-
28
-
29
-
 30
30 -
 31
31 -
 32
32 -
 33
33 -
 34
34 -
 35
35 -
 36
36 -
 37
37 -
 38
38 -
 39
39 -
 40
40 -
 41
41 -
 42
42 -
 43
43 -
 44
44 -
 45
45 -
 46
46 -
 47
47 -
 48
48 -
 49
49 -
 50
50 -
51
-
52
-
53
-
54
-
55
-
56
-
57
-
58
-
59
-
60
-
61
-
62
-
63
-
64
-
65
-
66
-
67
-
68
-
69
-
70
-
71
-
72
-
73
-
74
-
75
-
76
-
77
-
78
-
79
-
80
-
81
-
82
-
83
-
84
-
85
-
86
-
87
-
88
-
89
-
90
-
91
-
92
-
93
-
94
-
95
-
96
-
97
-
98
-
99
-
100
-
101
-
102
-
103
-
104
-
105
-
106
-
107
-
108
-
109
-
110
-
111
-
112
-
113
-
114
-
115
-
116
-
117
-
118
-
119
-
120
-
121
-
122
-
123
-
124
-
125
-
126
-
127
-
128
-
129
-
130
-
131
-
132
-
133
-
134
-
135
-
136
-
137
-
138
-
139
-
140
-
141
-
142
-
143
-
144
-
145
-
146
-
147
-
148
-
149
-
150
-
151
-
152
-
153
-
154
-
155
-
156
-
157
-
158
-
159
-
160
-
161
-
162
-
163
-
164
-
165
-
166
-
167
-
168
-
169
-
170
-
171
-
172
-
173
-
174
-
175
-
176
-
177
-
178
-
179
-
180
-
181
-
182
-
183
-
184
-
185
-
186
-
187
-
188
-
189
-
190
-
191
-
192
-
193
-
194
-
195
-
196
-
197
-
198
-
199
-
200
-
201
-
202
-
203
-
204
-
205
-
206
-
207
-
208
-
209
-
210
-
211
-
212
-
213
-
214
-
215
-
216
-
217
-
218
-
219
-
220
-
221
-
222
-
223
-
224
-
225
-
226
-
227
-
228
-
229
-
230
-
231
-
232
-
233
-
234
-
235
-
236
-
237
-
238
-
239
-
240
-
241
-
242
-
243
-
244
-
245
-
246
-
247
-
248
-
249
-
250
-
251
-
252
-
253
-
254
-
255
-
256
-
257
-
258
-
259
-
260
-
261
-
262
-
263
-
264
-
265
-
266
-
267
-
268
-
269
-
270
-
271
-
272
-
273
-
274
-
275
-
276
-
277
-
278
-
279
-
280
-
281
-
282
-
283
-
284
 |
 |

HSBC HOLDINGS PLC
Financial Review (continued)
38
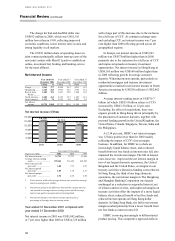
The charge for bad and doubtful debts was
US$932 million in 2000, which was US$1,141
million lower than in 1999, reflecting improved
economic conditions, lower interest rates in Asia and
strong liquidity in all markets.
The US$51 million share of operating losses in
joint ventures principally reflects start-up costs of the
new joint venture with Merrill Lynch to establish an
online, investment led, broking and banking service
for the mass affluent.
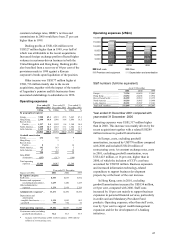
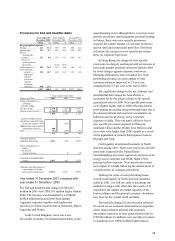
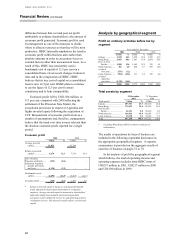
Net interest income
Year ended 31
December 2001
Year ended 31
December 2000
Year ended 31
December 1999
US$m % US$
m
%US$
m
%
Europe ............... 5,563 37.7 4,988 36.3 4,231 35.3
Hong Kong ........ 4,165 28.3 3,997 29.1 3,735 31.2
Rest of Asia-
Pacific ...........
1,482 10.1 1,367 10.0 1,240 10.3
North America ... 2,402 16.3 2,152 15.7 1,687 14.1
Latin America .... 1,113 7.6 1,219 8.9 1,097 9.1
Net interest
income........... 14,725 100.0 13,723 100.0 11,990 100.0
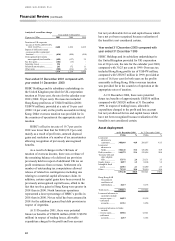
Net interest income (US$m)
Year ended 31 December
Figures in US$m 2001 2000 1999
Net interest income ............... 14,725 13,723 11,990
Average interest-earning
assets................................ 579,665 516,185 419,225
Gross interest yield
(per cent)1 ........................ 6.08 7.31 6.97
Net interest spread
(per cent) 2 ........................ 2.09 2.10 2.31
Net interest margin
(per cent)3 ........................ 2.54 2.66 2.86
1Gross interest yield is the average interest rate earned on average
interest-earning assets (AIEA).
2Net interest spread is the difference between the average interest
rate earned on average interest-earning assets and the average
interest rate paid on average interest-bearing funds.
3Net interest margin is net interest income expressed as a
percentage of average interest-earning assets.
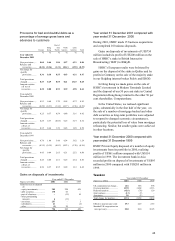
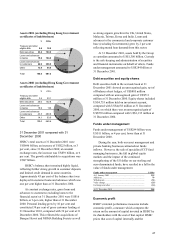
Year ended 31 December 2001 compared with
year ended 31 December 2000
Net interest income in 2001 was US$1,002 million,
or 7 per cent, higher than 2000 at US$14,725 million
with a large part of this increase due to the inclusion
for a full year of CCF. At constant exchange rates
and excluding CCF, net interest income was 7 per
cent higher than 2000 reflecting growth across all
geographical regions.
In Europe, net interest income at US$5,563
million was US$575million higher than in 2000
primarily due to the inclusion for a full year of CCF
and improved spreads on treasury investment
opportunities. Net interest income in Hong Kong at
US$4,165 million was US$168 million higher than
in 2000 reflecting growth in average customer
deposits. Widening interest spreads, particularly on
residential mortgages and treasury investment
opportunities resulted in net interest income in North
America increasing by US$250 million to US$2,402
million.
Average interest-earning assets at US$579.7
billion (of which US$55.4 billion relates to CCF)
increased by US$63.5 billion, or 12 per cent.
Excluding the effect of acquisitions, there was
organic growth in Hong Kong driven principally by
the placement of customer deposits, together with
personal lending growth in the United Kingdom, the
United States, Canada, Singapore, Taiwan, India and
the Philippines.
At 2.54 per cent, HSBC’s net interest margin
was 12 basis points lower than for 2000 mainly
reflecting the impact of CCF’s lower margin
business. In addition, for HSBC as a whole an
increasingly liquid balance sheet, and a reduced
benefit from net free funds as interest rates fell, also
impacted the net interest margin. The fall in interest
rates, however, improved the net interest margin in
two of our largest domestic operations, the United
Kingdom and the United States, as margins in our
treasury activities widened as funding costs reduced.
In Hong Kong, the third of our large domestic
operations, the net interest margin in The Hongkong
and Shanghai Banking Corporation was largely
unchanged as a reduction in suspended interest, net
of releases and recoveries, and improved margins on
treasury activities offset the impacts of a more liquid
balance sheet, reduced benefit of net free funds and
reduced interest spreads on Hong Kong dollar
deposits. In Hang Seng Bank, the fall in net interest
margin resulted primarily from a lower benefit from
net free funds as interest rates fell.
HSBC is moving increasingly to differentiated
product pricing. This competitive approach reflects
14,725 13,723
11,990
0
3,000
6,000
9,000
12,000
15,000
18,000
2001 2000 1999