HSBC 2001 Annual Report Download - page 156
Download and view the complete annual report
Please find page 156 of the 2001 HSBC annual report below. You can navigate through the pages in the report by either clicking on the pages listed below, or by using the keyword search tool below to find specific information within the annual report.-
 1
1 -
2
-
3
-
4
-
5
-
6
-
7
-
8
-
9
-
10
-
11
-
12
-
13
-
14
-
15
-
16
-
17
-
18
-
19
-
20
-
21
-
22
-
23
-
24
-
25
-
26
-
27
-
28
-
29
-
30
-
31
-
32
-
33
-
34
-
35
-
36
-
37
-
38
-
39
-
40
-
41
-
42
-
43
-
44
-
45
-
46
-
47
-
48
-
49
-
50
-
51
-
52
-
53
-
54
-
55
-
56
-
57
-
58
-
59
-
60
-
61
-
62
-
63
-
64
-
65
-
66
-
67
-
68
-
69
-
70
-
71
-
72
-
73
-
74
-
75
-
76
-
77
-
78
-
79
-
80
-
81
-
82
-
83
-
84
-
85
-
86
-
87
-
88
-
89
-
90
-
91
-
92
-
93
-
94
-
95
-
96
-
97
-
98
-
99
-
100
-
101
-
102
-
103
-
104
-
105
-
106
-
107
-
108
-
109
-
110
-
111
-
112
-
113
-
114
-
115
-
116
-
117
-
118
-
119
-
120
-
121
-
122
-
123
-
124
-
125
-
126
-
127
-
128
-
129
-
130
-
131
-
132
-
133
-
134
-
135
-
136
-
137
-
138
-
139
-
140
-
141
-
142
-
143
-
144
-
145
-
 146
146 -
 147
147 -
 148
148 -
 149
149 -
 150
150 -
 151
151 -
 152
152 -
 153
153 -
 154
154 -
 155
155 -
 156
156 -
 157
157 -
 158
158 -
 159
159 -
 160
160 -
 161
161 -
 162
162 -
 163
163 -
 164
164 -
 165
165 -
 166
166 -
167
-
168
-
169
-
170
-
171
-
172
-
173
-
174
-
175
-
176
-
177
-
178
-
179
-
180
-
181
-
182
-
183
-
184
-
185
-
186
-
187
-
188
-
189
-
190
-
191
-
192
-
193
-
194
-
195
-
196
-
197
-
198
-
199
-
200
-
201
-
202
-
203
-
204
-
205
-
206
-
207
-
208
-
209
-
210
-
211
-
212
-
213
-
214
-
215
-
216
-
217
-
218
-
219
-
220
-
221
-
222
-
223
-
224
-
225
-
226
-
227
-
228
-
229
-
230
-
231
-
232
-
233
-
234
-
235
-
236
-
237
-
238
-
239
-
240
-
241
-
242
-
243
-
244
-
245
-
246
-
247
-
248
-
249
-
250
-
251
-
252
-
253
-
254
-
255
-
256
-
257
-
258
-
259
-
260
-
261
-
262
-
263
-
264
-
265
-
266
-
267
-
268
-
269
-
270
-
271
-
272
-
273
-
274
-
275
-
276
-
277
-
278
-
279
-
280
-
281
-
282
-
283
-
284
 |
 |

HSBC HOLDINGS PLC
Report of the Directors (continued)
154
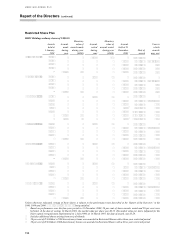
Restricted Share Plan
HSBC Holdings ordinary shares of US$0.50 Monetary Monetary
Awards Awards value o
f
Awards value o
f
Awards Year in
held a
t
made awards made veste
d
awards veste
d
held at 31 which
1 January durin
g
during year durin
g
during year 1December
D
ate o
f
awards
2001 year (£000) year1(£000) 20012awar
d
may ves
t
Sir John Bond .... 25,921 12,961 107 14 Mar 1997
27,397 28,501 2 Mar 1998 2002 or 2003
53,210 55,353 4 Mar 1999 2004
78,624 81,791 10 Mar 2000 2005
–
73,683 700 76,651 12 Mar 2001 2006
W R P Dalton..... 16,211 8,106 67 14 Mar 1997
18,267 19,003 2 Mar 1998 2002 or 2003
31,039 32,290 4 Mar 1999 2004
35,739 37,178 10 Mar 2000 2005
–
42,105 400 43,801 12 Mar 2001 2006
D G Eldon.......... 19,453 9,727 80 14 Mar 1997
21,917 22,799 2 Mar 1998 2002 or 2003
31,039 32,290 4 Mar 1999 2004
6,805 7,07933 Apr 2000 2003
35,739 37,178 10 Mar 2000 2005
42,105 400 43,801 12 Mar 2001 2006
6,353 59 6,454430 Apr 2001 2004
D J Flint ............ 16,211 8,106 67 14 Mar 1997
18,267 19,003 2 Mar 1998 2002 or 2003
31,039 32,290 4 Mar 1999 2004
32,164 33,460 10 Mar 2000 2005
52,631 500 54,751 12 Mar 2001 2006
S K Green.......... 19,453 9,727 80 14 Mar 1997
21,917 22,799 2 Mar 1998 2002 or 2003
31,039 32,290 4 Mar 1999 2004
35,739 37,178 10 Mar 2000 2005
–73,683 700 76,651 12 Mar 2001 2006
A W Jebson....... 10,808 5,404 44 14 Mar 1997
9,134 9,502 2 Mar 1998 2002 or 2003
26,605 27,677 4 Mar 1999 2004
28,590 29,742 10 Mar 2000 2005
63,157 600 65,701 12 Mar 2001 2006
K R Whitson ..... 19,453 9,727 80 14 Mar 1997
21,917 22,799 2 Mar 1998 2002 or 2003
44,342 46,128 4 Mar 1999 2004
50,034 52,049 10 Mar 2000 2005
57,894 550 60,226 12 Mar 2001 2006
Unless otherwise indicated, vesting of these shares is subject to the performance tests described in the ‘Report of the Directors’ in the
1998, 1999 and 2000 Annual Report and Accounts being satisfied.
1 Based on performance over the four-year period to 31 December 2000, 50 per cent of share awards vested and 50 per cent were
forfeited. At the date of vesting, 14 March 2001, the market value per share was £8.22. The market value per share (adjusted for the
share capital reorganisation implemented on 2 July 1999) on 14 March 1997, the date of award, was £5.28.
2 Includes additional shares arising from scrip dividends.
3 50 per cent of D G Eldon’s 1999 discretionary bonus was awarded in Restricted Shares with a three-year restricted period.
4 50 per cent of D G Eldon's 2000 discretionary bonus was awarded in Restricted Shares with a three-year restricted period.