HP 2015 Annual Report Download - page 79
Download and view the complete annual report
Please find page 79 of the 2015 HP annual report below. You can navigate through the pages in the report by either clicking on the pages listed below, or by using the keyword search tool below to find specific information within the annual report.-
 1
1 -
2
-
3
-
4
-
5
-
6
-
7
-
8
-
9
-
10
-
11
-
12
-
13
-
14
-
15
-
16
-
17
-
18
-
19
-
20
-
21
-
22
-
23
-
24
-
25
-
26
-
27
-
28
-
29
-
30
-
31
-
32
-
33
-
34
-
35
-
36
-
37
-
38
-
39
-
40
-
41
-
42
-
43
-
44
-
45
-
46
-
47
-
48
-
49
-
50
-
51
-
52
-
53
-
54
-
55
-
56
-
57
-
58
-
59
-
60
-
61
-
62
-
63
-
64
-
65
-
66
-
67
-
68
-
 69
69 -
 70
70 -
 71
71 -
 72
72 -
 73
73 -
 74
74 -
 75
75 -
 76
76 -
 77
77 -
 78
78 -
 79
79 -
 80
80 -
 81
81 -
 82
82 -
 83
83 -
 84
84 -
 85
85 -
 86
86 -
 87
87 -
 88
88 -
 89
89 -
90
-
91
-
92
-
93
-
94
-
95
-
96
-
97
-
98
-
99
-
100
-
101
-
102
-
103
-
104
-
105
-
106
-
107
-
108
-
109
-
110
-
111
-
112
-
113
-
114
-
115
-
116
-
117
-
118
-
119
-
120
-
121
-
122
-
123
-
124
-
125
-
126
-
127
-
128
-
129
-
130
-
131
-
132
-
133
-
134
-
135
-
136
-
137
-
138
-
139
-
140
-
141
-
142
-
143
-
144
-
145
-
146
-
147
-
148
-
149
-
150
-
151
-
152
-
153
-
154
-
155
-
156
-
157
-
158
-
159
-
160
-
161
-
162
-
163
-
164
-
165
-
166
-
167
-
168
-
169
-
170
-
171
-
172
-
173
-
174
-
175
-
176
-
177
-
178
-
179
-
180
-
181
-
182
-
183
-
184
-
185
-
186
-
187
-
188
-
189
-
190
-
191
-
192
-
193
-
194
-
195
-
196
-
197
-
198
-
199
-
200
-
201
-
202
-
203
-
204
-
205
-
206
-
207
-
208
-
209
-
210
-
211
-
212
-
213
-
214
-
215
-
216
-
217
-
218
-
219
-
220
-
221
-
222
-
223
-
224
-
225
-
226
-
227
-
228
-
229
-
230
-
231
-
232
-
233
-
234
-
235
-
236
-
237
-
238
-
239
-
240
 |
 |

Table of Contents
Net cash provided by operating activities decreased by approximately $5.8 billion for fiscal 2015 as compared to fiscal 2014. The decrease was due
primarily to lower cash generated from working capital management activities, payments for separation costs, lower cash receipts from contract manufacturers
and financing receivables, lower net earnings in the current period, unfavorable currency impacts, as well as higher cash payments for prepaids and employee
benefits. Net cash provided by operating activities increased by $0.7 billion for fiscal 2014 as compared to fiscal 2013, due primarily to improvements in
working capital management.
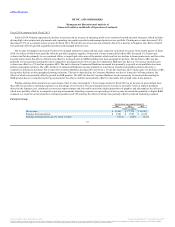
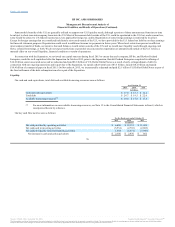
Our key working capital metrics were as follows:
Days of sales outstanding in accounts receivable ("DSO") measures the average number of days our receivables are outstanding. DSO is calculated by
dividing ending accounts receivable, net of allowance for doubtful accounts, by a 90-day average of net revenue. For fiscal 2015, the increase in DSO was
due primarily to lower usage of cash discounts by our customers and longer standard payment terms for Aruba. For fiscal 2014, the decrease in DSO was due
primarily to the impact of currency and the expansion of our factoring programs.
Days of supply in inventory ("DOS") measures the average number of days from procurement to sale of our product. DOS is calculated by dividing
ending inventory by a 90-day average of cost of goods sold. For fiscal 2015, the increase in DOS was due to higher inventory balance to support future sales
levels. For fiscal 2014, the increase in DOS was due to a higher inventory balance in Personal Systems due in part to strategic and advanced buys.
Days of purchases outstanding in accounts payable ("DPO") measures the average number of days our accounts payable balances are outstanding. DPO is
calculated by dividing ending accounts payable by a 90-day average of cost of goods sold. For fiscal 2015, the increase in DPO was primarily the result of
purchasing linearity and an extension of payment terms with our product suppliers. For fiscal 2014, the increase in DPO was primarily the result of an
extension of payment terms with our product suppliers.
The cash conversion cycle is the sum of DSO and DOS less DPO. Items which may cause the cash conversion cycle in a particular period to differ from a
long-term sustainable rate include, but are not limited to, changes in business mix, changes in payment terms, extent of receivables factoring, seasonal trends
and the timing of revenue recognition and inventory purchases within the period.
Net cash used in investing activities increased by approximately $2.7 billion for fiscal 2015 as compared to fiscal 2014, due primarily to the acquisition
of Aruba. Net cash used in investing activities
77
Days of sales outstanding in accounts receivable 47 44 49
Days of supply in inventory 30 27 24
Days of purchases outstanding in accounts payable (74) (67) (56)
Cash conversion cycle 3 4 17
Source: HP INC, 10-K, December 16, 2015 Powered by Morningstar® Document Research℠
The information contained herein may not be copied, adapted or distributed and is not warranted to be accurate, complete or timely. The user assumes all risks for any damages or losses arising from any use of this information,
except to the extent such damages or losses cannot be limited or excluded by applicable law. Past financial performance is no guarantee of future results.