HP 2015 Annual Report Download - page 64
Download and view the complete annual report
Please find page 64 of the 2015 HP annual report below. You can navigate through the pages in the report by either clicking on the pages listed below, or by using the keyword search tool below to find specific information within the annual report.-
 1
1 -
2
-
3
-
4
-
5
-
6
-
7
-
8
-
9
-
10
-
11
-
12
-
13
-
14
-
15
-
16
-
17
-
18
-
19
-
20
-
21
-
22
-
23
-
24
-
25
-
26
-
27
-
28
-
29
-
30
-
31
-
32
-
33
-
34
-
35
-
36
-
37
-
38
-
39
-
40
-
41
-
42
-
43
-
44
-
45
-
46
-
47
-
48
-
49
-
50
-
51
-
52
-
53
-
 54
54 -
 55
55 -
 56
56 -
 57
57 -
 58
58 -
 59
59 -
 60
60 -
 61
61 -
 62
62 -
 63
63 -
 64
64 -
 65
65 -
 66
66 -
 67
67 -
 68
68 -
 69
69 -
 70
70 -
 71
71 -
 72
72 -
 73
73 -
 74
74 -
75
-
76
-
77
-
78
-
79
-
80
-
81
-
82
-
83
-
84
-
85
-
86
-
87
-
88
-
89
-
90
-
91
-
92
-
93
-
94
-
95
-
96
-
97
-
98
-
99
-
100
-
101
-
102
-
103
-
104
-
105
-
106
-
107
-
108
-
109
-
110
-
111
-
112
-
113
-
114
-
115
-
116
-
117
-
118
-
119
-
120
-
121
-
122
-
123
-
124
-
125
-
126
-
127
-
128
-
129
-
130
-
131
-
132
-
133
-
134
-
135
-
136
-
137
-
138
-
139
-
140
-
141
-
142
-
143
-
144
-
145
-
146
-
147
-
148
-
149
-
150
-
151
-
152
-
153
-
154
-
155
-
156
-
157
-
158
-
159
-
160
-
161
-
162
-
163
-
164
-
165
-
166
-
167
-
168
-
169
-
170
-
171
-
172
-
173
-
174
-
175
-
176
-
177
-
178
-
179
-
180
-
181
-
182
-
183
-
184
-
185
-
186
-
187
-
188
-
189
-
190
-
191
-
192
-
193
-
194
-
195
-
196
-
197
-
198
-
199
-
200
-
201
-
202
-
203
-
204
-
205
-
206
-
207
-
208
-
209
-
210
-
211
-
212
-
213
-
214
-
215
-
216
-
217
-
218
-
219
-
220
-
221
-
222
-
223
-
224
-
225
-
226
-
227
-
228
-
229
-
230
-
231
-
232
-
233
-
234
-
235
-
236
-
237
-
238
-
239
-
240
 |
 |

Table of Contents
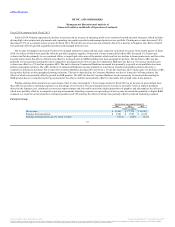
For a reconciliation of our effective tax rate to the U.S. federal statutory rate of 35% and further explanation of our provision for taxes, see Note 6 to the
Consolidated Financial Statements in Item 8, which is incorporated herein by reference.
In fiscal 2015, we recorded $1.6 billion of net income tax benefits related to items unique to the year. These amounts included $1.8 billion tax benefit
due to a release of valuation allowances pertaining to certain U.S. deferred tax assets and $486 million tax charge to record valuation allowances on certain
foreign deferred tax assets, both related to legal entities within the ES business, $394 million of tax charges for adjustments to uncertain tax positions and the
settlement of tax audit matters, inclusive of $449 million of tax charges related to pension transfers, and $3 million of tax charges for various provision to
return adjustments and other adjustments. In addition, we recorded $639 million of net tax benefits on restructuring, separation-related and other charges and
a tax benefit of $47 million arising from the retroactive research and development credit resulting from the Tax Increase Prevention Act of 2014, which was
signed into law in December 2014.
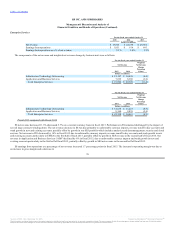
We recorded gross deferred tax assets of $12.5 billion, $14.0 billion and $13.6 billion at October 31, 2015, 2014 and 2013 which were reduced by
valuation allowances of $9.9 billion, $11.9 billion and $11.4 billion respectively. Total valuation allowances decreased by $2 billion in fiscal 2015
associated with the release of a valuation allowance against deferred tax assets in the U.S., and increased by $525 million in fiscal 2014, associated primarily
with foreign net operating losses.
In fiscal 2014, we recorded $53 million of net income tax charges related to items unique to the year.
In fiscal 2013, we recorded $471 million of net income tax charges related to items unique to the year. These amounts included $214 million of net
increases to valuation allowances, $406 million of tax charges for adjustments to uncertain tax positions and the settlement of tax audit matters and
$47 million of tax charges for various prior period adjustments. In addition, we recorded $146 million of tax benefits from adjustments to prior year foreign
income tax accruals and a tax benefit of $50 million arising from the retroactive research and development credit resulting from the American Taxpayer
Relief Act of 2012, which was signed into law in January 2013.
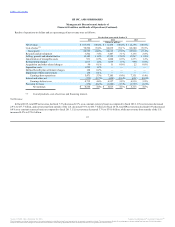
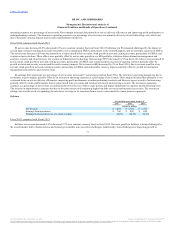
A description of the products and services for each segment can be found in Note 2 to the Consolidated Financial Statements in Item 8, which is
incorporated herein by reference. Future changes to this organizational structure may result in changes to the segments disclosed.
Effective at the beginning of its first quarter of fiscal 2015, we implemented an organizational change to align our segment financial reporting more
closely with its current business structure. This organizational change resulted in the transfer of third-party multi-vendor support arrangements from the TS
business unit within the EG segment to the ITO business unit within the ES segment. We have reflected this change to our segment information
retrospectively to the earliest period presented, which has resulted in the removal of intersegment revenue from the TS business unit within the EG segment
and the related corporate intersegment revenue eliminations, and the transfer of operating profit from the TS business unit within the EG segment to the ITO
business unit within the ES segment.
In connection with the Separation, effective at the beginning of its fourth quarter of fiscal 2015, we implemented an organizational change which
resulted in the transfer of marketing optimization solutions business from the Software segment to the Commercial Hardware business unit within the
62
Source: HP INC, 10-K, December 16, 2015 Powered by Morningstar® Document Research℠
The information contained herein may not be copied, adapted or distributed and is not warranted to be accurate, complete or timely. The user assumes all risks for any damages or losses arising from any use of this information,
except to the extent such damages or losses cannot be limited or excluded by applicable law. Past financial performance is no guarantee of future results.