HP 2015 Annual Report Download - page 124
Download and view the complete annual report
Please find page 124 of the 2015 HP annual report below. You can navigate through the pages in the report by either clicking on the pages listed below, or by using the keyword search tool below to find specific information within the annual report.-
 1
1 -
2
-
3
-
4
-
5
-
6
-
7
-
8
-
9
-
10
-
11
-
12
-
13
-
14
-
15
-
16
-
17
-
18
-
19
-
20
-
21
-
22
-
23
-
24
-
25
-
26
-
27
-
28
-
29
-
30
-
31
-
32
-
33
-
34
-
35
-
36
-
37
-
38
-
39
-
40
-
41
-
42
-
43
-
44
-
45
-
46
-
47
-
48
-
49
-
50
-
51
-
52
-
53
-
54
-
55
-
56
-
57
-
58
-
59
-
60
-
61
-
62
-
63
-
64
-
65
-
66
-
67
-
68
-
69
-
70
-
71
-
72
-
73
-
74
-
75
-
76
-
77
-
78
-
79
-
80
-
81
-
82
-
83
-
84
-
85
-
86
-
87
-
88
-
89
-
90
-
91
-
92
-
93
-
94
-
95
-
96
-
97
-
98
-
99
-
100
-
101
-
102
-
103
-
104
-
105
-
106
-
107
-
108
-
109
-
110
-
111
-
112
-
113
-
 114
114 -
 115
115 -
 116
116 -
 117
117 -
 118
118 -
 119
119 -
 120
120 -
 121
121 -
 122
122 -
 123
123 -
 124
124 -
 125
125 -
 126
126 -
 127
127 -
 128
128 -
 129
129 -
 130
130 -
 131
131 -
 132
132 -
 133
133 -
 134
134 -
135
-
136
-
137
-
138
-
139
-
140
-
141
-
142
-
143
-
144
-
145
-
146
-
147
-
148
-
149
-
150
-
151
-
152
-
153
-
154
-
155
-
156
-
157
-
158
-
159
-
160
-
161
-
162
-
163
-
164
-
165
-
166
-
167
-
168
-
169
-
170
-
171
-
172
-
173
-
174
-
175
-
176
-
177
-
178
-
179
-
180
-
181
-
182
-
183
-
184
-
185
-
186
-
187
-
188
-
189
-
190
-
191
-
192
-
193
-
194
-
195
-
196
-
197
-
198
-
199
-
200
-
201
-
202
-
203
-
204
-
205
-
206
-
207
-
208
-
209
-
210
-
211
-
212
-
213
-
214
-
215
-
216
-
217
-
218
-
219
-
220
-
221
-
222
-
223
-
224
-
225
-
226
-
227
-
228
-
229
-
230
-
231
-
232
-
233
-
234
-
235
-
236
-
237
-
238
-
239
-
240
 |
 |

Table of Contents
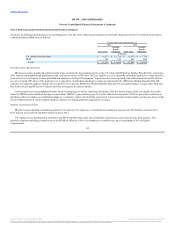
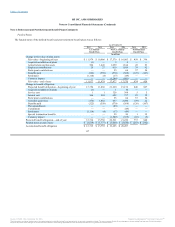
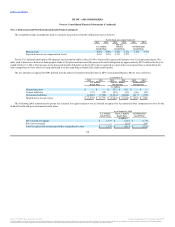
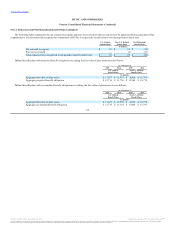
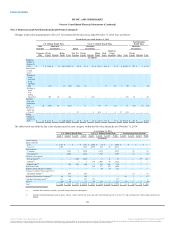
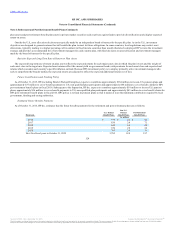
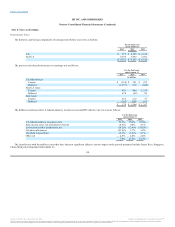
Changes in fair value measurements of Level 3 investments for the fiscal year ended October 31, 2014 were as follows:
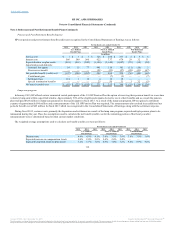
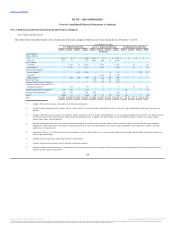
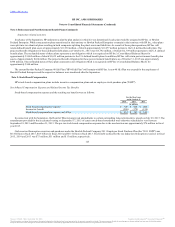
The following is a description of the valuation methodologies used to measure plan assets at fair value. There have been no changes in the
methodologies used during the reporting period.
Investments in publicly-traded equity securities are valued using the closing price on the measurement date as reported on the stock exchange on which
the individual securities are traded. For corporate, government and asset-backed debt securities, fair value is based on observable inputs of comparable
market transactions. For corporate and government debt securities traded on active exchanges, fair value is based on observable quoted prices. The valuation
of alternative investments, such as limited partnerships and joint ventures, may require significant management judgment. For alternative investments,
valuation is based on net asset value ("NAV") as reported by the Asset Manager and adjusted for cash flows, if necessary. In making such an assessment, a
variety of factors
122
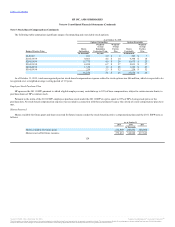
(3) Includes a fund that invests in both private and public equities primarily in the U.S. and the United Kingdom, as well as emerging markets across all sectors. The fund also holds
fixed income and derivative instruments to hedge interest rate and inflation risk. In addition, the fund includes units in transferable securities, collective investment schemes,
money market funds, cash and deposits.
(4) Includes limited partnerships that invest both long and short primarily in common stocks and credit, relative value, event driven equity, distressed debt and macro strategies.
Management of the hedge funds has the ability to shift investments from value to growth strategies, from small to large capitalization stocks and bonds, and from a net long
position to a net short position.
(5) Department of Labor 103-12 IE (Investment Entity) designation is for plan assets held by two or more unrelated employee benefit plans which includes limited partnerships and
venture capital partnerships.
(6) Includes publicly and privately traded Registered Investment Entities.
(7) Includes cash and cash equivalents such as short-term marketable securities.
(8) Includes international insured contracts, derivative instruments and unsettled transactions.
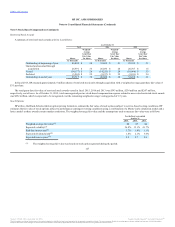
Beginning balance
at October 31,
2013 $ — $ 1,250 $ 2 $ 113 $1,365 $ 77 $ 48 $ — $ 204 $ 325 $ 81 $ 2 $ 737 $ 234 $ 1 $ 235
Actual return on
plan assets:
Relating to
assets still
held at the
reporting
date — 92 1 10 103 3 2 — 14 46 (8) — 57 51 — 51
Relating to
assets sold
during the
period — 169 — — 169 — 2 — (1) — — — 1 21 — 21
Purchases, sales,
and settlements
(net) 7 (227) — 140 (80) — (1) 43 68 108 (2) — 216 (35) — (35)
Transfers in and/or
out of Level 3 — — — — — — — — — 64 8 — 72 — — —
Ending balance at
October 31,
2014 $ 7 $ 1,284 $ 3 $ 263 $1,557 $ 80 $ 51 $ 43 $ 285 $ 543 $ 79 $ 2 $ 1,083 $ 271 $ 1 $ 272
Source: HP INC, 10-K, December 16, 2015 Powered by Morningstar® Document Research℠
The information contained herein may not be copied, adapted or distributed and is not warranted to be accurate, complete or timely. The user assumes all risks for any damages or losses arising from any use of this information,
except to the extent such damages or losses cannot be limited or excluded by applicable law. Past financial performance is no guarantee of future results.