HP 2015 Annual Report Download - page 125
Download and view the complete annual report
Please find page 125 of the 2015 HP annual report below. You can navigate through the pages in the report by either clicking on the pages listed below, or by using the keyword search tool below to find specific information within the annual report.-
 1
1 -
2
-
3
-
4
-
5
-
6
-
7
-
8
-
9
-
10
-
11
-
12
-
13
-
14
-
15
-
16
-
17
-
18
-
19
-
20
-
21
-
22
-
23
-
24
-
25
-
26
-
27
-
28
-
29
-
30
-
31
-
32
-
33
-
34
-
35
-
36
-
37
-
38
-
39
-
40
-
41
-
42
-
43
-
44
-
45
-
46
-
47
-
48
-
49
-
50
-
51
-
52
-
53
-
54
-
55
-
56
-
57
-
58
-
59
-
60
-
61
-
62
-
63
-
64
-
65
-
66
-
67
-
68
-
69
-
70
-
71
-
72
-
73
-
74
-
75
-
76
-
77
-
78
-
79
-
80
-
81
-
82
-
83
-
84
-
85
-
86
-
87
-
88
-
89
-
90
-
91
-
92
-
93
-
94
-
95
-
96
-
97
-
98
-
99
-
100
-
101
-
102
-
103
-
104
-
105
-
106
-
107
-
108
-
109
-
110
-
111
-
112
-
113
-
114
-
 115
115 -
 116
116 -
 117
117 -
 118
118 -
 119
119 -
 120
120 -
 121
121 -
 122
122 -
 123
123 -
 124
124 -
 125
125 -
 126
126 -
 127
127 -
 128
128 -
 129
129 -
 130
130 -
 131
131 -
 132
132 -
 133
133 -
 134
134 -
 135
135 -
136
-
137
-
138
-
139
-
140
-
141
-
142
-
143
-
144
-
145
-
146
-
147
-
148
-
149
-
150
-
151
-
152
-
153
-
154
-
155
-
156
-
157
-
158
-
159
-
160
-
161
-
162
-
163
-
164
-
165
-
166
-
167
-
168
-
169
-
170
-
171
-
172
-
173
-
174
-
175
-
176
-
177
-
178
-
179
-
180
-
181
-
182
-
183
-
184
-
185
-
186
-
187
-
188
-
189
-
190
-
191
-
192
-
193
-
194
-
195
-
196
-
197
-
198
-
199
-
200
-
201
-
202
-
203
-
204
-
205
-
206
-
207
-
208
-
209
-
210
-
211
-
212
-
213
-
214
-
215
-
216
-
217
-
218
-
219
-
220
-
221
-
222
-
223
-
224
-
225
-
226
-
227
-
228
-
229
-
230
-
231
-
232
-
233
-
234
-
235
-
236
-
237
-
238
-
239
-
240
 |
 |

Table of Contents
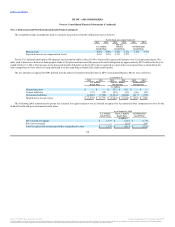
are reviewed by management, including, but not limited to, the timeliness of NAV as reported by the asset manager and changes in general economic and
market conditions subsequent to the last NAV reported by the asset manager. Depending on the amount of management judgment, the lack of near-term
liquidity, and the absence of quoted market prices, these assets are classified in Level 2 or Level 3 of the fair value hierarchy. Further, depending on how
quickly HP can redeem its hedge fund investments, and the extent of any adjustments to NAV, hedge funds are classified in either Level 2 or Level 3 of the
fair value hierarchy. Common collective trusts, interests in 103-12 entities and registered investment companies are valued at NAV. The valuation for some of
these assets requires judgment due to the absence of quoted market prices, and these assets are generally classified in Level 2 of the fair value hierarchy. Cash
and cash equivalents includes money market funds, which are valued based on NAV. Other assets, including insurance group annuity contracts, were
classified in the fair value hierarchy based on the lowest level input (e.g., quoted prices and observable inputs) that is significant to the fair value measure in
its entirety.
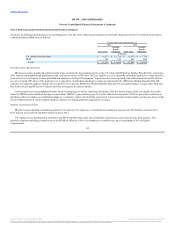
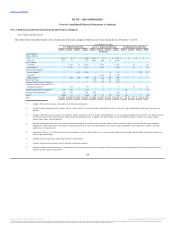
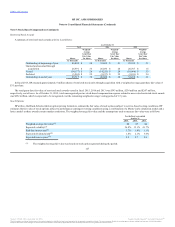
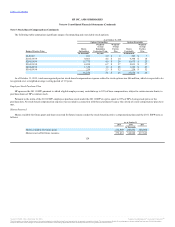
The weighted-average target and actual asset allocations across the benefit plans at the respective measurement dates were as follows:
HP's investment strategy is to seek a competitive rate of return relative to an appropriate level of risk depending on the funded status of each plan and the
timing of expected benefit payments. The majority of the plans' investment managers employ active investment management strategies with the goal of
outperforming the broad markets in which they invest. Risk management practices include diversification across asset classes and investment styles and
periodic rebalancing toward asset allocation targets. A number of the plans' investment managers are authorized to utilize derivatives for investment or
liability exposures, and HP may utilize derivatives to effect asset allocation changes or to hedge certain investment or liability exposures.
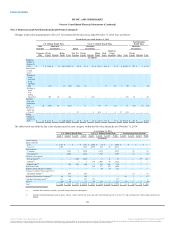
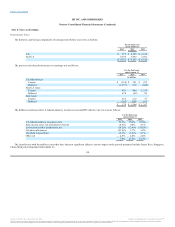
The target asset allocation selected for each U.S. plan reflects a risk/return profile HP believes is appropriate relative to each plan's liability structure and
return goals. HP conducts periodic asset-liability studies for U.S. plans in order to model various potential asset allocations in comparison to each plan's
forecasted liabilities and liquidity needs. HP invests a portion of the U.S. defined benefit
123
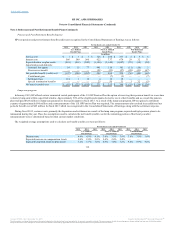
Public equity securities 34.2% 31.3% 45.7% 46.8% 10.7% 10.2%
Private/other equity securities 16.4% 15.8% 15.9% 15.2% 53.4% 58.6%
Real estate and other (1.7)% 0.6% 6.9% 7.1% (1.8)% —
Equity-related investments 53.5% 48.9% 47.7% 66.4% 68.5% 69.1% 66.1% 62.3% 68.8%
Debt securities 46.1% 47.5% 49.2% 33.4% 28.7% 27.6% 32.0% 33.2% 27.5%
Cash 0.4% 3.6% 3.1% 0.2% 2.8% 3.3% 1.9% 4.5% 3.7%
Total 100.0% 100.0% 100.0% 100.0% 100.0% 100.0% 100.0% 100.0% 100.0%
Source: HP INC, 10-K, December 16, 2015 Powered by Morningstar® Document Research℠
The information contained herein may not be copied, adapted or distributed and is not warranted to be accurate, complete or timely. The user assumes all risks for any damages or losses arising from any use of this information,
except to the extent such damages or losses cannot be limited or excluded by applicable law. Past financial performance is no guarantee of future results.