HP 2015 Annual Report Download - page 152
Download and view the complete annual report
Please find page 152 of the 2015 HP annual report below. You can navigate through the pages in the report by either clicking on the pages listed below, or by using the keyword search tool below to find specific information within the annual report.-
 1
1 -
2
-
3
-
4
-
5
-
6
-
7
-
8
-
9
-
10
-
11
-
12
-
13
-
14
-
15
-
16
-
17
-
18
-
19
-
20
-
21
-
22
-
23
-
24
-
25
-
26
-
27
-
28
-
29
-
30
-
31
-
32
-
33
-
34
-
35
-
36
-
37
-
38
-
39
-
40
-
41
-
42
-
43
-
44
-
45
-
46
-
47
-
48
-
49
-
50
-
51
-
52
-
53
-
54
-
55
-
56
-
57
-
58
-
59
-
60
-
61
-
62
-
63
-
64
-
65
-
66
-
67
-
68
-
69
-
70
-
71
-
72
-
73
-
74
-
75
-
76
-
77
-
78
-
79
-
80
-
81
-
82
-
83
-
84
-
85
-
86
-
87
-
88
-
89
-
90
-
91
-
92
-
93
-
94
-
95
-
96
-
97
-
98
-
99
-
100
-
101
-
102
-
103
-
104
-
105
-
106
-
107
-
108
-
109
-
110
-
111
-
112
-
113
-
114
-
115
-
116
-
117
-
118
-
119
-
120
-
121
-
122
-
123
-
124
-
125
-
126
-
127
-
128
-
129
-
130
-
131
-
132
-
133
-
134
-
135
-
136
-
137
-
138
-
139
-
140
-
141
-
 142
142 -
 143
143 -
 144
144 -
 145
145 -
 146
146 -
 147
147 -
 148
148 -
 149
149 -
 150
150 -
 151
151 -
 152
152 -
 153
153 -
 154
154 -
 155
155 -
 156
156 -
 157
157 -
 158
158 -
 159
159 -
 160
160 -
 161
161 -
 162
162 -
163
-
164
-
165
-
166
-
167
-
168
-
169
-
170
-
171
-
172
-
173
-
174
-
175
-
176
-
177
-
178
-
179
-
180
-
181
-
182
-
183
-
184
-
185
-
186
-
187
-
188
-
189
-
190
-
191
-
192
-
193
-
194
-
195
-
196
-
197
-
198
-
199
-
200
-
201
-
202
-
203
-
204
-
205
-
206
-
207
-
208
-
209
-
210
-
211
-
212
-
213
-
214
-
215
-
216
-
217
-
218
-
219
-
220
-
221
-
222
-
223
-
224
-
225
-
226
-
227
-
228
-
229
-
230
-
231
-
232
-
233
-
234
-
235
-
236
-
237
-
238
-
239
-
240
 |
 |

Table of Contents
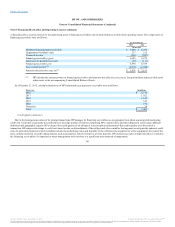
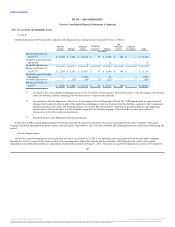
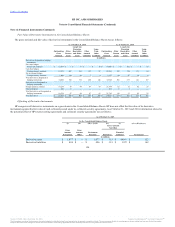
The following table presents HP's assets and liabilities that are measured at fair value on a recurring basis:
There were no transfers between the fair value hierarchy during fiscal 2015 and 2014.
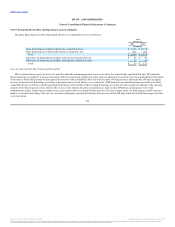
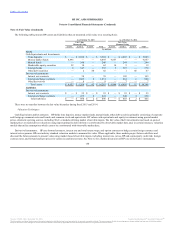
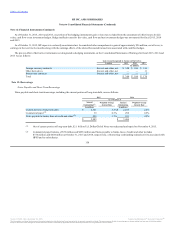
Cash Equivalents and Investments: HP holds time deposits, money market funds, mutual funds, other debt securities primarily consisting of corporate
and foreign government notes and bonds, and common stock and equivalents. HP values cash equivalents and equity investments using quoted market
prices, alternative pricing sources, including NAV, or models utilizing market observable inputs. The fair value of debt investments was based on quoted
market prices or model-driven valuations using inputs primarily derived from or corroborated by observable market data, and, in certain instances, valuation
models that utilize assumptions which cannot be corroborated with observable market data.
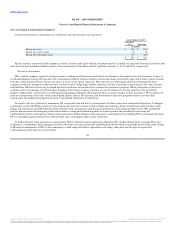
Derivative Instruments: HP uses forward contracts, interest rate and total return swaps, and option contracts to hedge certain foreign currency and
interest rate exposures. HP uses industry standard valuation models to measure fair value. Where applicable, these models project future cash flows and
discount the future amounts to present value using market-based observable inputs, including interest rate curves, HP and counterparty credit risk, foreign
currency rates, and forward and spot prices for currencies and interest rates. See Note 12 for a further discussion of HP's use of derivative instruments.
150
Cash Equivalents and Investments:
Time deposits $ — $ 3,584 $ — $ 3,584 $ — $ 2,865 $ — $ 2,865
Money market funds 8,895 — — 8,895 9,857 — — 9,857
Mutual funds — 246 — 246 — 244 — 244
Marketable equity securities 52 10 — 62 14 5 — 19
Foreign bonds 8 347 — 355 9 367 — 376
Other debt securities — 2 40 42 — 1 46 47
Derivative Instruments:
Interest rate contracts — 38 — 38 — 105 — 105
Foreign exchange contracts — 1,029 2 1,031 — 862 6 868
Other derivatives — 8 — 8 — 7 — 7
Total assets $ 8,955 $ 5,264 $ 42 $ 14,261 $ 9,880 $ 4,456 $ 52 $ 14,388
Derivative Instruments:
Interest rate contracts $ — $ 55 $ — $ 55 $ — $ 55 $ — $ 55
Foreign exchange contracts — 439 2 441 — 348 2 350
Total liabilities $ — $ 494 $ 2 $ 496 $ — $ 403 $ 2 $ 405
Source: HP INC, 10-K, December 16, 2015 Powered by Morningstar® Document Research℠
The information contained herein may not be copied, adapted or distributed and is not warranted to be accurate, complete or timely. The user assumes all risks for any damages or losses arising from any use of this information,
except to the extent such damages or losses cannot be limited or excluded by applicable law. Past financial performance is no guarantee of future results.