HP 2015 Annual Report Download - page 69
Download and view the complete annual report
Please find page 69 of the 2015 HP annual report below. You can navigate through the pages in the report by either clicking on the pages listed below, or by using the keyword search tool below to find specific information within the annual report.-
 1
1 -
2
-
3
-
4
-
5
-
6
-
7
-
8
-
9
-
10
-
11
-
12
-
13
-
14
-
15
-
16
-
17
-
18
-
19
-
20
-
21
-
22
-
23
-
24
-
25
-
26
-
27
-
28
-
29
-
30
-
31
-
32
-
33
-
34
-
35
-
36
-
37
-
38
-
39
-
40
-
41
-
42
-
43
-
44
-
45
-
46
-
47
-
48
-
49
-
50
-
51
-
52
-
53
-
54
-
55
-
56
-
57
-
58
-
 59
59 -
 60
60 -
 61
61 -
 62
62 -
 63
63 -
 64
64 -
 65
65 -
 66
66 -
 67
67 -
 68
68 -
 69
69 -
 70
70 -
 71
71 -
 72
72 -
 73
73 -
 74
74 -
 75
75 -
 76
76 -
 77
77 -
 78
78 -
 79
79 -
80
-
81
-
82
-
83
-
84
-
85
-
86
-
87
-
88
-
89
-
90
-
91
-
92
-
93
-
94
-
95
-
96
-
97
-
98
-
99
-
100
-
101
-
102
-
103
-
104
-
105
-
106
-
107
-
108
-
109
-
110
-
111
-
112
-
113
-
114
-
115
-
116
-
117
-
118
-
119
-
120
-
121
-
122
-
123
-
124
-
125
-
126
-
127
-
128
-
129
-
130
-
131
-
132
-
133
-
134
-
135
-
136
-
137
-
138
-
139
-
140
-
141
-
142
-
143
-
144
-
145
-
146
-
147
-
148
-
149
-
150
-
151
-
152
-
153
-
154
-
155
-
156
-
157
-
158
-
159
-
160
-
161
-
162
-
163
-
164
-
165
-
166
-
167
-
168
-
169
-
170
-
171
-
172
-
173
-
174
-
175
-
176
-
177
-
178
-
179
-
180
-
181
-
182
-
183
-
184
-
185
-
186
-
187
-
188
-
189
-
190
-
191
-
192
-
193
-
194
-
195
-
196
-
197
-
198
-
199
-
200
-
201
-
202
-
203
-
204
-
205
-
206
-
207
-
208
-
209
-
210
-
211
-
212
-
213
-
214
-
215
-
216
-
217
-
218
-
219
-
220
-
221
-
222
-
223
-
224
-
225
-
226
-
227
-
228
-
229
-
230
-
231
-
232
-
233
-
234
-
235
-
236
-
237
-
238
-
239
-
240
 |
 |

Table of Contents
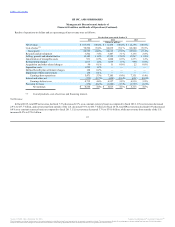
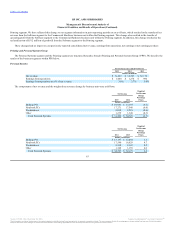
In fiscal 2014, Printing experienced a decline in revenue and an increase in operating profit as we continued to push our print strategies, which includes
driving high value printer unit placements and expanding our graphics products and managed print services portfolio. Printing net revenue decreased 3.8%
(decreased 3.3% on a constant currency basis) for fiscal 2014. The decline in net revenue was primarily driven by a decline in Supplies, the effects of which
were partially offset by growth in graphics products and managed print services.
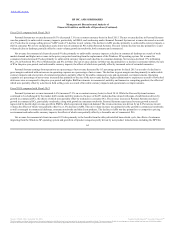
Net revenue for Supplies decreased 5% driven by demand weakness in toner and ink, and a reduction in channel inventory in the fourth quarter of fiscal
2014, the effects of which were partially offset by growth in graphics supplies. Printer unit volume remained flat while ARU decreased 1%. Printer unit
volume was flat due primarily to our continued efforts to target high value areas of the market, which resulted in a decline in home printer units and low value
LaserJet printer units, the effects of which were offset by increased units in SMB, multifunction laser and graphics printers. The decline in ARU was due
primarily to increased discounting driven by competitive pricing pressures. Net revenue for Commercial Hardware was flat as a 3% increase in printer unit
volume was offset by a 3% decline in printer ARU. The unit volume in Commercial Hardware increased due primarily to growth in our multifunction laser
printers and graphics printers. The ARU decline in Commercial Hardware was due primarily to a decline in LaserJet and graphics printers driven by a
competitive pricing environment. Net revenue for Consumer Hardware decreased 4% driven by a 1% decline in printer unit volume and a 1% decline in ARU,
along with a decline in other peripheral printing solutions. The unit volume decline in Consumer Hardware was due to lower sales of home printers, the
effects of which were partially offset by growth in SMB printers. The ARU decline in Consumer Hardware was due primarily to increased discounting for
SMB printers due to a competitive pricing environment, the effects of which were partially offset by a favorable mix of high value home printers.
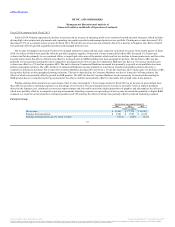
Printing earnings from operations as a percentage of net revenue increased by 1.8 percentage points for fiscal 2014 as an increase in gross margin more
than offset an increase in operating expenses as a percentage of net revenue. The gross margin increase was due to favorable currency impacts primarily
driven by the Japanese yen, continued cost structure improvements and a favorable mix from a higher proportion of graphics and ink supplies, the effects of
which were partially offset by a competitive pricing environment. Operating expenses as a percentage of net revenue increased due primarily to higher R&D
expenses as a result of our investments in enterprise products and 3-D printing, the effects of which were partially offset by reduced marketing expenses.
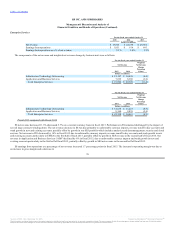
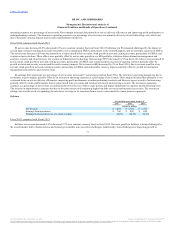
Enterprise Group
67
Net revenue $ 27,907 $ 27,723 $ 28,003
Earnings from operations $ 3,981 $ 3,995 $ 4,245
Earnings from operations as a % of net revenue 14.3% 14.4% 15.2%
Source: HP INC, 10-K, December 16, 2015 Powered by Morningstar® Document Research℠
The information contained herein may not be copied, adapted or distributed and is not warranted to be accurate, complete or timely. The user assumes all risks for any damages or losses arising from any use of this information,
except to the extent such damages or losses cannot be limited or excluded by applicable law. Past financial performance is no guarantee of future results.