HP 2015 Annual Report Download - page 129
Download and view the complete annual report
Please find page 129 of the 2015 HP annual report below. You can navigate through the pages in the report by either clicking on the pages listed below, or by using the keyword search tool below to find specific information within the annual report.-
 1
1 -
2
-
3
-
4
-
5
-
6
-
7
-
8
-
9
-
10
-
11
-
12
-
13
-
14
-
15
-
16
-
17
-
18
-
19
-
20
-
21
-
22
-
23
-
24
-
25
-
26
-
27
-
28
-
29
-
30
-
31
-
32
-
33
-
34
-
35
-
36
-
37
-
38
-
39
-
40
-
41
-
42
-
43
-
44
-
45
-
46
-
47
-
48
-
49
-
50
-
51
-
52
-
53
-
54
-
55
-
56
-
57
-
58
-
59
-
60
-
61
-
62
-
63
-
64
-
65
-
66
-
67
-
68
-
69
-
70
-
71
-
72
-
73
-
74
-
75
-
76
-
77
-
78
-
79
-
80
-
81
-
82
-
83
-
84
-
85
-
86
-
87
-
88
-
89
-
90
-
91
-
92
-
93
-
94
-
95
-
96
-
97
-
98
-
99
-
100
-
101
-
102
-
103
-
104
-
105
-
106
-
107
-
108
-
109
-
110
-
111
-
112
-
113
-
114
-
115
-
116
-
117
-
118
-
 119
119 -
 120
120 -
 121
121 -
 122
122 -
 123
123 -
 124
124 -
 125
125 -
 126
126 -
 127
127 -
 128
128 -
 129
129 -
 130
130 -
 131
131 -
 132
132 -
 133
133 -
 134
134 -
 135
135 -
 136
136 -
 137
137 -
 138
138 -
 139
139 -
140
-
141
-
142
-
143
-
144
-
145
-
146
-
147
-
148
-
149
-
150
-
151
-
152
-
153
-
154
-
155
-
156
-
157
-
158
-
159
-
160
-
161
-
162
-
163
-
164
-
165
-
166
-
167
-
168
-
169
-
170
-
171
-
172
-
173
-
174
-
175
-
176
-
177
-
178
-
179
-
180
-
181
-
182
-
183
-
184
-
185
-
186
-
187
-
188
-
189
-
190
-
191
-
192
-
193
-
194
-
195
-
196
-
197
-
198
-
199
-
200
-
201
-
202
-
203
-
204
-
205
-
206
-
207
-
208
-
209
-
210
-
211
-
212
-
213
-
214
-
215
-
216
-
217
-
218
-
219
-
220
-
221
-
222
-
223
-
224
-
225
-
226
-
227
-
228
-
229
-
230
-
231
-
232
-
233
-
234
-
235
-
236
-
237
-
238
-
239
-
240
 |
 |

Table of Contents
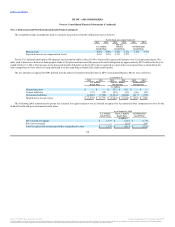
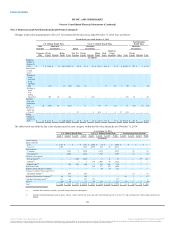
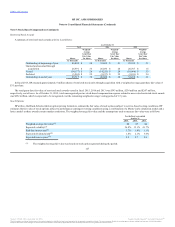
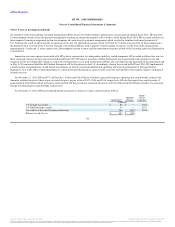
A summary of restricted stock awards activity is as follows:
In fiscal 2015, HP assumed approximately 8 million shares of restricted stock units through acquisition with a weighted-average grant date fair value of
$33 per share.
The total grant date fair value of restricted stock awards vested in fiscal 2015, 2014 and 2013 was $593 million, $234 million and $247 million,
respectively, net of taxes. As of October 31, 2015, total unrecognized pre-tax stock-based compensation expense related to non-vested restricted stock awards
was $652 million, which is expected to be recognized over the remaining weighted-average vesting period of 1.5 years.
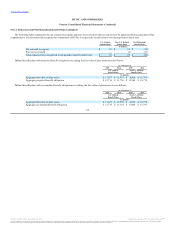
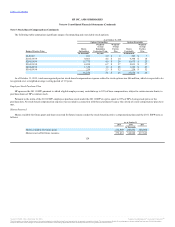
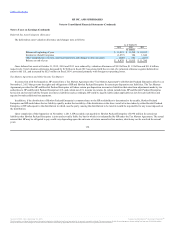
HP utilizes the Black-Scholes-Merton option pricing formula to estimate the fair value of stock options subject to service-based vesting conditions. HP
estimates the fair value of stock options subject to performance-contingent vesting conditions using a combination of a Monte Carlo simulation model and a
lattice model as these awards contain market conditions. The weighted-average fair value and the assumptions used to measure fair value were as follows:
127
Outstanding at beginning of year 40,808 $ 24 32,262 $ 21 25,532 $ 31
Granted and assumed through
acquisition 26,991 $ 35 26,036 $ 28 20,707 $ 15
Vested (34,177) $ 26 (14,253) $ 24 (10,966) $ 33
Forfeited (3,905) $ 29 (3,237) $ 22 (3,011) $ 24
Outstanding at end of year 29,717 $ 32 40,808 $ 24 32,262 $ 21
Weighted-average fair value(1) $8 $7 $4
Expected volatility(2) 26.8% 33.1% 41.7%
Risk-free interest rate(3) 1.7% 1.8% 1.1%
Expected dividend yield(4) 1.8% 2.1% 3.6%
Expected term in years(5) 5.9 5.7 5.9
(1) The weighted-average fair value was based on stock options granted during the period.
Source: HP INC, 10-K, December 16, 2015 Powered by Morningstar® Document Research℠
The information contained herein may not be copied, adapted or distributed and is not warranted to be accurate, complete or timely. The user assumes all risks for any damages or losses arising from any use of this information,
except to the extent such damages or losses cannot be limited or excluded by applicable law. Past financial performance is no guarantee of future results.