HP 2015 Annual Report Download - page 154
Download and view the complete annual report
Please find page 154 of the 2015 HP annual report below. You can navigate through the pages in the report by either clicking on the pages listed below, or by using the keyword search tool below to find specific information within the annual report.-
 1
1 -
2
-
3
-
4
-
5
-
6
-
7
-
8
-
9
-
10
-
11
-
12
-
13
-
14
-
15
-
16
-
17
-
18
-
19
-
20
-
21
-
22
-
23
-
24
-
25
-
26
-
27
-
28
-
29
-
30
-
31
-
32
-
33
-
34
-
35
-
36
-
37
-
38
-
39
-
40
-
41
-
42
-
43
-
44
-
45
-
46
-
47
-
48
-
49
-
50
-
51
-
52
-
53
-
54
-
55
-
56
-
57
-
58
-
59
-
60
-
61
-
62
-
63
-
64
-
65
-
66
-
67
-
68
-
69
-
70
-
71
-
72
-
73
-
74
-
75
-
76
-
77
-
78
-
79
-
80
-
81
-
82
-
83
-
84
-
85
-
86
-
87
-
88
-
89
-
90
-
91
-
92
-
93
-
94
-
95
-
96
-
97
-
98
-
99
-
100
-
101
-
102
-
103
-
104
-
105
-
106
-
107
-
108
-
109
-
110
-
111
-
112
-
113
-
114
-
115
-
116
-
117
-
118
-
119
-
120
-
121
-
122
-
123
-
124
-
125
-
126
-
127
-
128
-
129
-
130
-
131
-
132
-
133
-
134
-
135
-
136
-
137
-
138
-
139
-
140
-
141
-
142
-
143
-
 144
144 -
 145
145 -
 146
146 -
 147
147 -
 148
148 -
 149
149 -
 150
150 -
 151
151 -
 152
152 -
 153
153 -
 154
154 -
 155
155 -
 156
156 -
 157
157 -
 158
158 -
 159
159 -
 160
160 -
 161
161 -
 162
162 -
 163
163 -
 164
164 -
165
-
166
-
167
-
168
-
169
-
170
-
171
-
172
-
173
-
174
-
175
-
176
-
177
-
178
-
179
-
180
-
181
-
182
-
183
-
184
-
185
-
186
-
187
-
188
-
189
-
190
-
191
-
192
-
193
-
194
-
195
-
196
-
197
-
198
-
199
-
200
-
201
-
202
-
203
-
204
-
205
-
206
-
207
-
208
-
209
-
210
-
211
-
212
-
213
-
214
-
215
-
216
-
217
-
218
-
219
-
220
-
221
-
222
-
223
-
224
-
225
-
226
-
227
-
228
-
229
-
230
-
231
-
232
-
233
-
234
-
235
-
236
-
237
-
238
-
239
-
240
 |
 |

Table of Contents
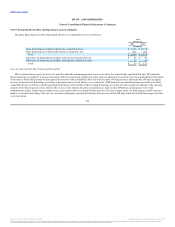
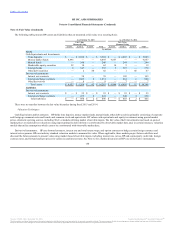
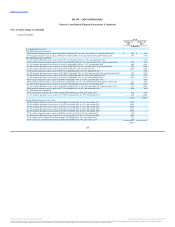
Cash equivalents and available-for-sale investments were as follows:
All highly liquid investments with original maturities of three months or less at the date of acquisition are considered cash equivalents. As of October 31,
2015 and 2014, the carrying amount of cash equivalents approximated fair value due to the short period of time to maturity. Interest income related to cash,
cash equivalents and debt securities was approximately $129 million in fiscal 2015, $136 million in fiscal 2014 and $148 million in fiscal 2013. Time
deposits were primarily issued by institutions outside the U.S. as of October 31, 2015 and 2014. The estimated fair value of the available-for-sale investments
may not be representative of values that will be realized in the future.
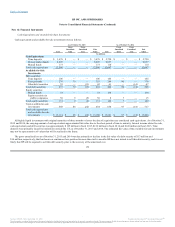
The gross unrealized loss as of October 31, 2015 and 2014 was due primarily to decline in the fair value of a debt security of $13 million and
$14 million, respectively, that has been in a continuous loss position for more than twelve months. HP does not intend to sell this debt security, and it is not
likely that HP will be required to sell this debt security prior to the recovery of the amortized cost.
152
Time deposits $ 3,478 $ — $ — $ 3,478 $ 2,720 $ — $ — $ 2,720
Money market funds 8,895 — — 8,895 9,857 — — 9,857
Mutual funds 173 — — 173 110 — — 110
Total cash equivalents 12,546 — — 12,546 12,687 — — 12,687
Debt securities:
Time deposits 106 — — 106 145 — — 145
Foreign bonds 276 79 — 355 286 90 — 376
Other debt securities 55 — (13) 42 61 — (14) 47
Total debt securities 437 79 (13) 503 492 90 (14) 568
Equity securities:
Mutual funds 73 — — 73 134 — — 134
Equity securities in
public companies 58 9 (9) 58 8 7 — 15
Total equity securities 131 9 (9) 131 142 7 — 149
Total available-for-sale
investments 568 88 (22) 634 634 97 (14) 717
Total cash equivalents
and available-for-sale
investments $ 13,114 $ 88 $ (22) $ 13,180 $ 13,321 $ 97 $ (14) $ 13,404
Source: HP INC, 10-K, December 16, 2015 Powered by Morningstar® Document Research℠
The information contained herein may not be copied, adapted or distributed and is not warranted to be accurate, complete or timely. The user assumes all risks for any damages or losses arising from any use of this information,
except to the extent such damages or losses cannot be limited or excluded by applicable law. Past financial performance is no guarantee of future results.