HP 2015 Annual Report Download - page 59
Download and view the complete annual report
Please find page 59 of the 2015 HP annual report below. You can navigate through the pages in the report by either clicking on the pages listed below, or by using the keyword search tool below to find specific information within the annual report.-
 1
1 -
2
-
3
-
4
-
5
-
6
-
7
-
8
-
9
-
10
-
11
-
12
-
13
-
14
-
15
-
16
-
17
-
18
-
19
-
20
-
21
-
22
-
23
-
24
-
25
-
26
-
27
-
28
-
29
-
30
-
31
-
32
-
33
-
34
-
35
-
36
-
37
-
38
-
39
-
40
-
41
-
42
-
43
-
44
-
45
-
46
-
47
-
48
-
 49
49 -
 50
50 -
 51
51 -
 52
52 -
 53
53 -
 54
54 -
 55
55 -
 56
56 -
 57
57 -
 58
58 -
 59
59 -
 60
60 -
 61
61 -
 62
62 -
 63
63 -
 64
64 -
 65
65 -
 66
66 -
 67
67 -
 68
68 -
 69
69 -
70
-
71
-
72
-
73
-
74
-
75
-
76
-
77
-
78
-
79
-
80
-
81
-
82
-
83
-
84
-
85
-
86
-
87
-
88
-
89
-
90
-
91
-
92
-
93
-
94
-
95
-
96
-
97
-
98
-
99
-
100
-
101
-
102
-
103
-
104
-
105
-
106
-
107
-
108
-
109
-
110
-
111
-
112
-
113
-
114
-
115
-
116
-
117
-
118
-
119
-
120
-
121
-
122
-
123
-
124
-
125
-
126
-
127
-
128
-
129
-
130
-
131
-
132
-
133
-
134
-
135
-
136
-
137
-
138
-
139
-
140
-
141
-
142
-
143
-
144
-
145
-
146
-
147
-
148
-
149
-
150
-
151
-
152
-
153
-
154
-
155
-
156
-
157
-
158
-
159
-
160
-
161
-
162
-
163
-
164
-
165
-
166
-
167
-
168
-
169
-
170
-
171
-
172
-
173
-
174
-
175
-
176
-
177
-
178
-
179
-
180
-
181
-
182
-
183
-
184
-
185
-
186
-
187
-
188
-
189
-
190
-
191
-
192
-
193
-
194
-
195
-
196
-
197
-
198
-
199
-
200
-
201
-
202
-
203
-
204
-
205
-
206
-
207
-
208
-
209
-
210
-
211
-
212
-
213
-
214
-
215
-
216
-
217
-
218
-
219
-
220
-
221
-
222
-
223
-
224
-
225
-
226
-
227
-
228
-
229
-
230
-
231
-
232
-
233
-
234
-
235
-
236
-
237
-
238
-
239
-
240
 |
 |

Table of Contents
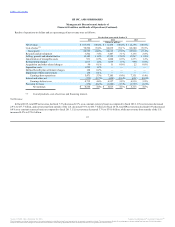
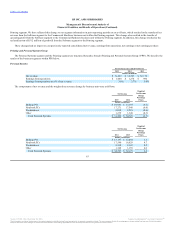
Results of operations in dollars and as a percentage of net revenue were as follows:
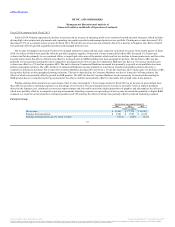
In fiscal 2015, total HP net revenue declined 7.3% (decreased 2.1% on a constant currency basis) as compared to fiscal 2014. U.S. net revenue decreased
2.9% to $37.7 billion, and net revenue from outside of the U.S. decreased 9.6% to $65.7 billion. In fiscal 2014, total HP net revenue declined 0.8% (decreased
0.4% on a constant currency basis) as compared to fiscal 2013. U.S. net revenue decreased 3.7% to $38.8 billion, while net revenue from outside of the U.S.
increased 0.9% to $72.6 billion.
57
Net revenue $ 103,355 100.0% $ 111,454 100.0% $ 112,298 100.0%
Cost of sales(1) 78,596 76.0% 84,839 76.1% 86,380 76.9%
Gross profit 24,759 24.0% 26,615 23.9% 25,918 23.1%
Research and development 3,502 3.4% 3,447 3.1% 3,135 2.8%
Selling, general and administrative 12,185 11.8% 13,353 12.0% 13,267 11.8%
Amortization of intangible assets 931 0.9% 1,000 0.9% 1,373 1.2%
Restructuring charges 1,017 1.0% 1,619 1.5% 990 0.9%
Acquisition and other related charges 90 0.1% 11 0.0% 22 0.0%
Separation costs 1,259 1.2% — — — —
Defined benefit plan settlement charges 168 0.2% — — — —
Impairment of data center assets 136 0.1% — — — —
Earnings from operations 5,471 5.3% 7,185 6.4% 7,131 6.4%
Interest and other, net (739) (0.7)% (628) (0.6)% (621) (0.6)%
Earnings before taxes 4,732 4.6% 6,557 5.8% 6,510 5.8%
Provision for taxes (178) (0.2)% (1,544) (1.3)% (1,397) (1.2)%
Net earnings $ 4,554 4.4% $ 5,013 4.5% $ 5,113 4.6%
(1) Cost of products, cost of services and financing interest.
Source: HP INC, 10-K, December 16, 2015 Powered by Morningstar® Document Research℠
The information contained herein may not be copied, adapted or distributed and is not warranted to be accurate, complete or timely. The user assumes all risks for any damages or losses arising from any use of this information,
except to the extent such damages or losses cannot be limited or excluded by applicable law. Past financial performance is no guarantee of future results.