HP 2015 Annual Report Download - page 67
Download and view the complete annual report
Please find page 67 of the 2015 HP annual report below. You can navigate through the pages in the report by either clicking on the pages listed below, or by using the keyword search tool below to find specific information within the annual report.-
 1
1 -
2
-
3
-
4
-
5
-
6
-
7
-
8
-
9
-
10
-
11
-
12
-
13
-
14
-
15
-
16
-
17
-
18
-
19
-
20
-
21
-
22
-
23
-
24
-
25
-
26
-
27
-
28
-
29
-
30
-
31
-
32
-
33
-
34
-
35
-
36
-
37
-
38
-
39
-
40
-
41
-
42
-
43
-
44
-
45
-
46
-
47
-
48
-
49
-
50
-
51
-
52
-
53
-
54
-
55
-
56
-
 57
57 -
 58
58 -
 59
59 -
 60
60 -
 61
61 -
 62
62 -
 63
63 -
 64
64 -
 65
65 -
 66
66 -
 67
67 -
 68
68 -
 69
69 -
 70
70 -
 71
71 -
 72
72 -
 73
73 -
 74
74 -
 75
75 -
 76
76 -
 77
77 -
78
-
79
-
80
-
81
-
82
-
83
-
84
-
85
-
86
-
87
-
88
-
89
-
90
-
91
-
92
-
93
-
94
-
95
-
96
-
97
-
98
-
99
-
100
-
101
-
102
-
103
-
104
-
105
-
106
-
107
-
108
-
109
-
110
-
111
-
112
-
113
-
114
-
115
-
116
-
117
-
118
-
119
-
120
-
121
-
122
-
123
-
124
-
125
-
126
-
127
-
128
-
129
-
130
-
131
-
132
-
133
-
134
-
135
-
136
-
137
-
138
-
139
-
140
-
141
-
142
-
143
-
144
-
145
-
146
-
147
-
148
-
149
-
150
-
151
-
152
-
153
-
154
-
155
-
156
-
157
-
158
-
159
-
160
-
161
-
162
-
163
-
164
-
165
-
166
-
167
-
168
-
169
-
170
-
171
-
172
-
173
-
174
-
175
-
176
-
177
-
178
-
179
-
180
-
181
-
182
-
183
-
184
-
185
-
186
-
187
-
188
-
189
-
190
-
191
-
192
-
193
-
194
-
195
-
196
-
197
-
198
-
199
-
200
-
201
-
202
-
203
-
204
-
205
-
206
-
207
-
208
-
209
-
210
-
211
-
212
-
213
-
214
-
215
-
216
-
217
-
218
-
219
-
220
-
221
-
222
-
223
-
224
-
225
-
226
-
227
-
228
-
229
-
230
-
231
-
232
-
233
-
234
-
235
-
236
-
237
-
238
-
239
-
240
 |
 |

Table of Contents
products. Net revenue for consumer clients remained flat as growth in consumer notebooks, partly driven by our new product lineup including Chromebooks
and hybrid products, was offset by a decline in consumer desktops. For fiscal 2014, net revenue for Notebook PCs increased 9%, Desktop PCs increased 3%,
Workstations increased 3% and Other net revenue increased 16%. The net revenue increase in Other was due to the sale of IP and growth in mobility
products, primarily consumer tablets which were introduced in the second half of fiscal 2013.
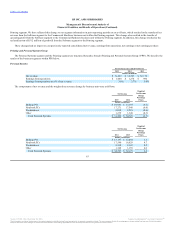
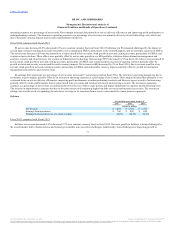
Personal Systems earnings from operations as a percentage of net revenue increased 0.7 percentage points for fiscal 2014. The increase was driven by an
increase in gross margin and a decline in operating expenses as a percentage of net revenue. The increase in gross margin was due primarily to operational
cost improvements, a favorable commercial mix and the sale of IP, the effects of which were partially offset by unfavorable currency impacts. Operating
expenses as a percentage of net revenue decreased due primarily to our cost structure optimization efforts, the effects of which were partially offset by
increased research and development investments for commercial, mobility and immersive computing products, as well as higher administrative expenses
driven by lower bad debt recoveries as compared to fiscal 2013.
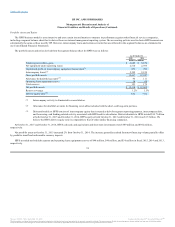
Printing
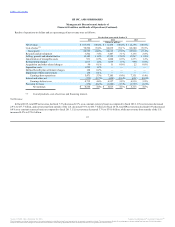
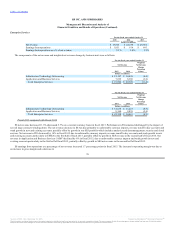
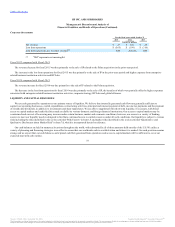
The components of the net revenue and weighted net revenue change by business unit were as follows:
65
Net revenue $ 21,232 $ 23,211 $ 24,128
Earnings from operations $ 3,865 $ 4,229 $ 3,953
Earnings from operations as a % of net revenue 18.2% 18.2% 16.4%
Supplies $ 13,979 $ 14,917 (4.0)
Commercial Hardware 5,378 5,949 (2.5)
Consumer Hardware 1,875 2,345 (2.0)
Total Printing $ 21,232 $ 23,211 (8.5)
Source: HP INC, 10-K, December 16, 2015 Powered by Morningstar® Document Research℠
The information contained herein may not be copied, adapted or distributed and is not warranted to be accurate, complete or timely. The user assumes all risks for any damages or losses arising from any use of this information,
except to the extent such damages or losses cannot be limited or excluded by applicable law. Past financial performance is no guarantee of future results.