HP 2015 Annual Report Download - page 48
Download and view the complete annual report
Please find page 48 of the 2015 HP annual report below. You can navigate through the pages in the report by either clicking on the pages listed below, or by using the keyword search tool below to find specific information within the annual report.-
 1
1 -
2
-
3
-
4
-
5
-
6
-
7
-
8
-
9
-
10
-
11
-
12
-
13
-
14
-
15
-
16
-
17
-
18
-
19
-
20
-
21
-
22
-
23
-
24
-
25
-
26
-
27
-
28
-
29
-
30
-
31
-
32
-
33
-
34
-
35
-
36
-
37
-
 38
38 -
 39
39 -
 40
40 -
 41
41 -
 42
42 -
 43
43 -
 44
44 -
 45
45 -
 46
46 -
 47
47 -
 48
48 -
 49
49 -
 50
50 -
 51
51 -
 52
52 -
 53
53 -
 54
54 -
 55
55 -
 56
56 -
 57
57 -
 58
58 -
59
-
60
-
61
-
62
-
63
-
64
-
65
-
66
-
67
-
68
-
69
-
70
-
71
-
72
-
73
-
74
-
75
-
76
-
77
-
78
-
79
-
80
-
81
-
82
-
83
-
84
-
85
-
86
-
87
-
88
-
89
-
90
-
91
-
92
-
93
-
94
-
95
-
96
-
97
-
98
-
99
-
100
-
101
-
102
-
103
-
104
-
105
-
106
-
107
-
108
-
109
-
110
-
111
-
112
-
113
-
114
-
115
-
116
-
117
-
118
-
119
-
120
-
121
-
122
-
123
-
124
-
125
-
126
-
127
-
128
-
129
-
130
-
131
-
132
-
133
-
134
-
135
-
136
-
137
-
138
-
139
-
140
-
141
-
142
-
143
-
144
-
145
-
146
-
147
-
148
-
149
-
150
-
151
-
152
-
153
-
154
-
155
-
156
-
157
-
158
-
159
-
160
-
161
-
162
-
163
-
164
-
165
-
166
-
167
-
168
-
169
-
170
-
171
-
172
-
173
-
174
-
175
-
176
-
177
-
178
-
179
-
180
-
181
-
182
-
183
-
184
-
185
-
186
-
187
-
188
-
189
-
190
-
191
-
192
-
193
-
194
-
195
-
196
-
197
-
198
-
199
-
200
-
201
-
202
-
203
-
204
-
205
-
206
-
207
-
208
-
209
-
210
-
211
-
212
-
213
-
214
-
215
-
216
-
217
-
218
-
219
-
220
-
221
-
222
-
223
-
224
-
225
-
226
-
227
-
228
-
229
-
230
-
231
-
232
-
233
-
234
-
235
-
236
-
237
-
238
-
239
-
240
 |
 |

Table of Contents
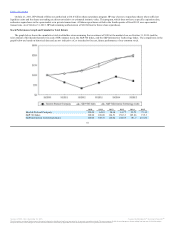
declines was the gross margin increase, lower selling, general and administrative ("SG&A") expenses and lower restructuring charges.
As of October 31, 2015, cash and cash equivalents and short- and long-term investments were $17.7 billion, representing an increase of approximately
$2.2 billion from the October 31, 2014 balance of $15.5 billion. The increase in cash and cash equivalents and short- and long-term investments in fiscal
2015 was primarily due to the following factors: cash received from operating cash flows of $6.5 billion and cash received for net issuances and repayments
of debt of $5.0 billion; partially offset by investments in property, plant and equipment and business acquisitions net of divestitures of $3.2 billion and
$2.4 billion, respectively, cash utilization for share repurchases of common stock of $2.9 billion and dividend payments to stockholders of $1.2 billion.
We continue to experience challenges that are representative of trends and uncertainties that may affect our business and results of operations. One set of
challenges relates to dynamic and accelerating market trends such as the decline in the PC market. Certain of our legacy hardware businesses face challenges
as customers migrate to cloud-based offerings and reduce their purchases of hardware products. A second set of challenges relates to changes in the
competitive landscape. Our major competitors are expanding their product and service offerings with integrated products and solutions, our business-specific
competitors are exerting increased competitive pressure in targeted areas and are entering new markets, our emerging competitors are introducing new
technologies and business models, and our alliance partners in some businesses are increasingly becoming our competitors in others. A third set of challenges
relates to business model changes and our go-to-market execution.
The macroeconomic weakness we have experienced has moderated in some geographic regions but remains an overall challenge. A discussion of some of
these challenges at the segment level is set forth below.
•In Personal Systems, we are witnessing soft demand in the Personal Computer ("PC") market as customers hold onto their PCs longer, thereby
extending PC refresh cycles. Demand for PCs is being impacted by weaker macroeconomic conditions and currency devaluations in certain
Asian and European markets. Additionally, industry wide, PC channels in some regions are working through excess channel inventory, which
is impacting sell in. As such, we see continued market headwinds for the next several quarters. However, we are optimistic and see opportunity
in the market long term given our strength in Commercial and the launch of Windows 10, combined with Intel's Skylake processor family
transition, which may represent a catalyst for demand through introduction of breakthrough form factors. In Personal Systems, we are
maintaining our strategic focus on profitable growth through improved market segmentation with respect to enhanced innovation in multi-
operating systems, multi-architecture, geography, customer segments and other key attributes. Additionally, HP is investing significantly in
premium and mobility form factors such as convertible notebooks, detachable notebooks, and commercial tablets in order to meet customer
preference for mobile, thinner and lighter devices.
•In Printing, we are experiencing the impact of the growth in mobility and demand challenges in consumer and commercial markets. We are
also experiencing an overall competitive pricing environment due to aggressive pricing from our Japanese competitors, given the weakness of
the Japanese yen. To be successful in addressing these challenges, we need to continue to execute on our key initiatives of focusing on
products targeted at high usage categories and introducing new revenue delivery models to consumer customers. In the consumer market, our
Ink in the Office products are driving unit volume due to our OfficeJet Pro product lines. The Ink in the Office
46
Source: HP INC, 10-K, December 16, 2015 Powered by Morningstar® Document Research℠
The information contained herein may not be copied, adapted or distributed and is not warranted to be accurate, complete or timely. The user assumes all risks for any damages or losses arising from any use of this information,
except to the extent such damages or losses cannot be limited or excluded by applicable law. Past financial performance is no guarantee of future results.