HP 2015 Annual Report Download - page 68
Download and view the complete annual report
Please find page 68 of the 2015 HP annual report below. You can navigate through the pages in the report by either clicking on the pages listed below, or by using the keyword search tool below to find specific information within the annual report.-
 1
1 -
2
-
3
-
4
-
5
-
6
-
7
-
8
-
9
-
10
-
11
-
12
-
13
-
14
-
15
-
16
-
17
-
18
-
19
-
20
-
21
-
22
-
23
-
24
-
25
-
26
-
27
-
28
-
29
-
30
-
31
-
32
-
33
-
34
-
35
-
36
-
37
-
38
-
39
-
40
-
41
-
42
-
43
-
44
-
45
-
46
-
47
-
48
-
49
-
50
-
51
-
52
-
53
-
54
-
55
-
56
-
57
-
 58
58 -
 59
59 -
 60
60 -
 61
61 -
 62
62 -
 63
63 -
 64
64 -
 65
65 -
 66
66 -
 67
67 -
 68
68 -
 69
69 -
 70
70 -
 71
71 -
 72
72 -
 73
73 -
 74
74 -
 75
75 -
 76
76 -
 77
77 -
 78
78 -
79
-
80
-
81
-
82
-
83
-
84
-
85
-
86
-
87
-
88
-
89
-
90
-
91
-
92
-
93
-
94
-
95
-
96
-
97
-
98
-
99
-
100
-
101
-
102
-
103
-
104
-
105
-
106
-
107
-
108
-
109
-
110
-
111
-
112
-
113
-
114
-
115
-
116
-
117
-
118
-
119
-
120
-
121
-
122
-
123
-
124
-
125
-
126
-
127
-
128
-
129
-
130
-
131
-
132
-
133
-
134
-
135
-
136
-
137
-
138
-
139
-
140
-
141
-
142
-
143
-
144
-
145
-
146
-
147
-
148
-
149
-
150
-
151
-
152
-
153
-
154
-
155
-
156
-
157
-
158
-
159
-
160
-
161
-
162
-
163
-
164
-
165
-
166
-
167
-
168
-
169
-
170
-
171
-
172
-
173
-
174
-
175
-
176
-
177
-
178
-
179
-
180
-
181
-
182
-
183
-
184
-
185
-
186
-
187
-
188
-
189
-
190
-
191
-
192
-
193
-
194
-
195
-
196
-
197
-
198
-
199
-
200
-
201
-
202
-
203
-
204
-
205
-
206
-
207
-
208
-
209
-
210
-
211
-
212
-
213
-
214
-
215
-
216
-
217
-
218
-
219
-
220
-
221
-
222
-
223
-
224
-
225
-
226
-
227
-
228
-
229
-
230
-
231
-
232
-
233
-
234
-
235
-
236
-
237
-
238
-
239
-
240
 |
 |

Table of Contents
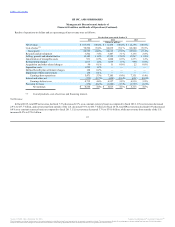
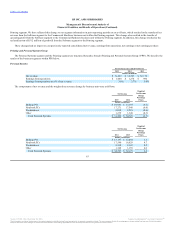
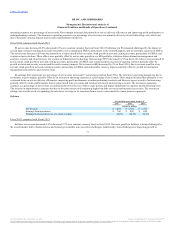
Printing net revenue decreased 8.5% (decreased 5.1% on a constant currency basis) for fiscal 2015. The decline in net revenue was due primarily to
unfavorable currency impacts, decline in Supplies, weak market demand and competitive pricing pressures, the effects of which were partially offset by
growth in graphics products. From a regional perspective, Printing experienced a net revenue decline across all regions, primarily in EMEA and particularly
in Russia as a result of challenges in those markets.
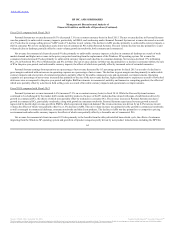
Net revenue for Supplies decreased 6% due primarily to unfavorable currency impacts and demand weakness in toner and ink, partially offset by growth
in graphics supplies. The demand weakness in toner was particularly in EMEA, led by a net revenue decline in Russia. Printer unit volumes declined 7%
while average revenue per unit ("ARU") decreased 7%. Printer unit volume declined due primarily to a decline in LaserJet and home printer units, the effects
of which were partially offset by growth in graphics printer units. The ARU for printers decreased due primarily to a highly competitive pricing environment
and unfavorable currency impacts on Inkjet and LaserJet printers. Net revenue for Commercial Hardware decreased 10% driven by a 7% decline in printer
unit volume and a 4% decline in ARU, partially offset by a net revenue increase in other peripheral solutions. In Commercial Hardware, the decline in unit
volume was due primarily to an overall decline in LaserJet printer units, partially offset by growth in graphics printer units. The ARU decline in Commercial
Hardware was due primarily to a competitive pricing environment and unfavorable currency impacts. Net revenue for Consumer Hardware decreased 20%
driven by a 13% decline in ARU and a 7% decline in unit volume. The ARU decline in Consumer Hardware was due primarily to a competitive pricing
environment and unfavorable currency impacts. The unit volume decline in Consumer Hardware was due primarily to lower sales of home and SMB printer
units.
Printing earnings from operations as a percentage of net revenue remained flat for fiscal 2015 due to a decline in gross margin, offset by lower operating
expenses as a percentage of net revenue. The decline in gross margin was due primarily to a competitive pricing environment in hardware and unfavorable
currency impacts, the effects of which were partially offset by a favorable mix of ink and graphics supplies and favorable currency impacts from the Japanese
yen. Operating expenses as a percentage of net revenue decreased due primarily to our cost saving initiatives, lower marketing expenses, the impact of the
divestiture of our photo printing service Snapfish and favorable currency impacts.
66
Supplies $ 14,917 $ 15,716 (3.3)
Consumer Hardware 2,345 2,436 (0.4)
Commercial Hardware 5,949 5,976 (0.1)
Total Printing $ 23,211 $ 24,128 (3.8)
Source: HP INC, 10-K, December 16, 2015 Powered by Morningstar® Document Research℠
The information contained herein may not be copied, adapted or distributed and is not warranted to be accurate, complete or timely. The user assumes all risks for any damages or losses arising from any use of this information,
except to the extent such damages or losses cannot be limited or excluded by applicable law. Past financial performance is no guarantee of future results.