HP 2015 Annual Report Download - page 119
Download and view the complete annual report
Please find page 119 of the 2015 HP annual report below. You can navigate through the pages in the report by either clicking on the pages listed below, or by using the keyword search tool below to find specific information within the annual report.-
 1
1 -
2
-
3
-
4
-
5
-
6
-
7
-
8
-
9
-
10
-
11
-
12
-
13
-
14
-
15
-
16
-
17
-
18
-
19
-
20
-
21
-
22
-
23
-
24
-
25
-
26
-
27
-
28
-
29
-
30
-
31
-
32
-
33
-
34
-
35
-
36
-
37
-
38
-
39
-
40
-
41
-
42
-
43
-
44
-
45
-
46
-
47
-
48
-
49
-
50
-
51
-
52
-
53
-
54
-
55
-
56
-
57
-
58
-
59
-
60
-
61
-
62
-
63
-
64
-
65
-
66
-
67
-
68
-
69
-
70
-
71
-
72
-
73
-
74
-
75
-
76
-
77
-
78
-
79
-
80
-
81
-
82
-
83
-
84
-
85
-
86
-
87
-
88
-
89
-
90
-
91
-
92
-
93
-
94
-
95
-
96
-
97
-
98
-
99
-
100
-
101
-
102
-
103
-
104
-
105
-
106
-
107
-
108
-
 109
109 -
 110
110 -
 111
111 -
 112
112 -
 113
113 -
 114
114 -
 115
115 -
 116
116 -
 117
117 -
 118
118 -
 119
119 -
 120
120 -
 121
121 -
 122
122 -
 123
123 -
 124
124 -
 125
125 -
 126
126 -
 127
127 -
 128
128 -
 129
129 -
130
-
131
-
132
-
133
-
134
-
135
-
136
-
137
-
138
-
139
-
140
-
141
-
142
-
143
-
144
-
145
-
146
-
147
-
148
-
149
-
150
-
151
-
152
-
153
-
154
-
155
-
156
-
157
-
158
-
159
-
160
-
161
-
162
-
163
-
164
-
165
-
166
-
167
-
168
-
169
-
170
-
171
-
172
-
173
-
174
-
175
-
176
-
177
-
178
-
179
-
180
-
181
-
182
-
183
-
184
-
185
-
186
-
187
-
188
-
189
-
190
-
191
-
192
-
193
-
194
-
195
-
196
-
197
-
198
-
199
-
200
-
201
-
202
-
203
-
204
-
205
-
206
-
207
-
208
-
209
-
210
-
211
-
212
-
213
-
214
-
215
-
216
-
217
-
218
-
219
-
220
-
221
-
222
-
223
-
224
-
225
-
226
-
227
-
228
-
229
-
230
-
231
-
232
-
233
-
234
-
235
-
236
-
237
-
238
-
239
-
240
 |
 |

Table of Contents
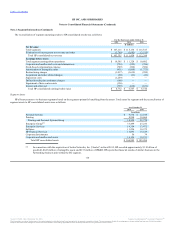
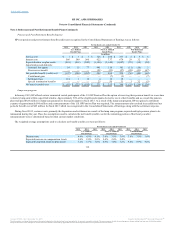
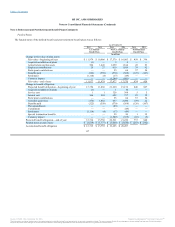
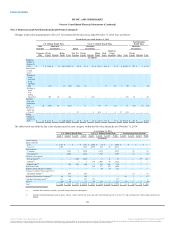
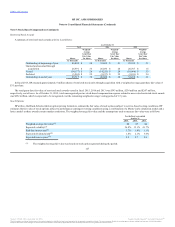
The funded status of the defined benefit and post-retirement benefit plans was as follows:
117
Change in fair value of plan assets:
Fair value—beginning of year $ 11,979 $ 10,866 $ 17,570 $ 16,083 $ 458 $ 396
Acquisition/addition of plans (1) — 5 8 — —
Actual return on plan assets 506 1,648 1,059 1,814 45 83
Employer contributions 29 27 619 1,019 39 92
Participant contributions — — 55 64 57 54
Benefits paid (322) (558) (570) (568) (125) (167)
Settlement (1,114) (4) (17) (49) — —
Currency impact — — (1,244) (801) — —
Fair value—end of year 11,077 11,979 17,477 17,570 474 458
Change in benefit obligation:
Projected benefit obligation—beginning of year 13,756 11,866 21,220 19,152 840 867
Acquisition/addition of plans (1) — 1 10 — —
Service cost 1 1 326 308 5 5
Interest cost 566 569 622 737 29 32
Participant contributions — — 55 64 57 54
Actuarial (gain) loss (170) 1,882 457 2,500 (59) 22
Benefits paid (322) (558) (570) (568) (126) (167)
Plan amendments — — (89) — — —
Curtailment — — — (49) — —
Settlement (1,114) (4) (17) (49) — —
Special termination benefits — — 25 50 1 32
Currency impact — — (1,509) (935) (10) (5)
Projected benefit obligation—end of year 12,716 13,756 20,521 21,220 737 840
Funded status at end of year $ (1,639) $ (1,777) $ (3,044) $ (3,650) $ (263) $ (382)
Accumulated benefit obligation $ 12,715 $ 13,755 $ 19,695 $ 20,207
Source: HP INC, 10-K, December 16, 2015 Powered by Morningstar® Document Research℠
The information contained herein may not be copied, adapted or distributed and is not warranted to be accurate, complete or timely. The user assumes all risks for any damages or losses arising from any use of this information,
except to the extent such damages or losses cannot be limited or excluded by applicable law. Past financial performance is no guarantee of future results.