HP 2015 Annual Report Download - page 60
Download and view the complete annual report
Please find page 60 of the 2015 HP annual report below. You can navigate through the pages in the report by either clicking on the pages listed below, or by using the keyword search tool below to find specific information within the annual report.-
 1
1 -
2
-
3
-
4
-
5
-
6
-
7
-
8
-
9
-
10
-
11
-
12
-
13
-
14
-
15
-
16
-
17
-
18
-
19
-
20
-
21
-
22
-
23
-
24
-
25
-
26
-
27
-
28
-
29
-
30
-
31
-
32
-
33
-
34
-
35
-
36
-
37
-
38
-
39
-
40
-
41
-
42
-
43
-
44
-
45
-
46
-
47
-
48
-
49
-
 50
50 -
 51
51 -
 52
52 -
 53
53 -
 54
54 -
 55
55 -
 56
56 -
 57
57 -
 58
58 -
 59
59 -
 60
60 -
 61
61 -
 62
62 -
 63
63 -
 64
64 -
 65
65 -
 66
66 -
 67
67 -
 68
68 -
 69
69 -
 70
70 -
71
-
72
-
73
-
74
-
75
-
76
-
77
-
78
-
79
-
80
-
81
-
82
-
83
-
84
-
85
-
86
-
87
-
88
-
89
-
90
-
91
-
92
-
93
-
94
-
95
-
96
-
97
-
98
-
99
-
100
-
101
-
102
-
103
-
104
-
105
-
106
-
107
-
108
-
109
-
110
-
111
-
112
-
113
-
114
-
115
-
116
-
117
-
118
-
119
-
120
-
121
-
122
-
123
-
124
-
125
-
126
-
127
-
128
-
129
-
130
-
131
-
132
-
133
-
134
-
135
-
136
-
137
-
138
-
139
-
140
-
141
-
142
-
143
-
144
-
145
-
146
-
147
-
148
-
149
-
150
-
151
-
152
-
153
-
154
-
155
-
156
-
157
-
158
-
159
-
160
-
161
-
162
-
163
-
164
-
165
-
166
-
167
-
168
-
169
-
170
-
171
-
172
-
173
-
174
-
175
-
176
-
177
-
178
-
179
-
180
-
181
-
182
-
183
-
184
-
185
-
186
-
187
-
188
-
189
-
190
-
191
-
192
-
193
-
194
-
195
-
196
-
197
-
198
-
199
-
200
-
201
-
202
-
203
-
204
-
205
-
206
-
207
-
208
-
209
-
210
-
211
-
212
-
213
-
214
-
215
-
216
-
217
-
218
-
219
-
220
-
221
-
222
-
223
-
224
-
225
-
226
-
227
-
228
-
229
-
230
-
231
-
232
-
233
-
234
-
235
-
236
-
237
-
238
-
239
-
240
 |
 |

Table of Contents
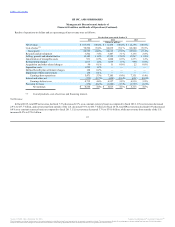
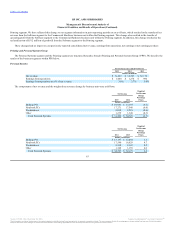
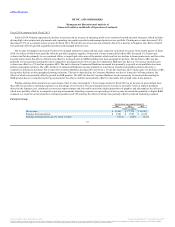
The components of the weighted net revenue change by segment were as follows:
For fiscal 2015, total net revenue decreased 7.3 percentage points. From a segment perspective, the primary factors contributing to the change in net
revenue are summarized as follows:
•Personal Systems net revenue decreased due primarily to unfavorable currency impacts, particularly in EMEA, and weakening market demand;
•ES net revenue decreased due primarily to unfavorable currency impacts, revenue runoff in key accounts and weak growth in new and existing
accounts;
•Printing net revenue decreased due primarily to unfavorable currency impacts, weak market demand and competitive pricing pressures;
•HPFS net revenue decreased due primarily to unfavorable currency impacts led by weakness in the euro and lower asset management activity
primarily in customer buyouts;
•Corporate Investments net revenue decreased due to the sale of IP in the prior-year period;
•Software net revenue decreased due primarily to unfavorable currency impacts and declines in license revenue; and
•EG net revenue increased due to growth in Industry Standard Servers ("ISS") and net revenue resulting from our acquisition of Aruba Networks,
Inc. ("Aruba") in May 2015.
For fiscal 2014, total net revenue decreased 0.8 percentage points. From a segment perspective, the primary factors contributing to the change in net
revenue are summarized as follows:
•ES net revenue declined due primarily to revenue runoff in key accounts, weak growth in new and existing accounts, particularly in EMEA,
and contractual price declines;
•Printing net revenue decreased due primarily to a decline in Supplies;
•EG net revenue decreased due to net revenue declines in TS, BCS and Storage;
58
Personal Systems (2.6) 1.8
Enterprise Services (2.3) (1.5)
Printing (1.8) (0.8)
HP Financial Services (0.3) (0.1)
Corporate Investments/Other (0.3) 0.1
Software (0.2) (0.1)
Enterprise Group 0.2 (0.2)
Total HP (7.3) (0.8)
Source: HP INC, 10-K, December 16, 2015 Powered by Morningstar® Document Research℠
The information contained herein may not be copied, adapted or distributed and is not warranted to be accurate, complete or timely. The user assumes all risks for any damages or losses arising from any use of this information,
except to the extent such damages or losses cannot be limited or excluded by applicable law. Past financial performance is no guarantee of future results.