HP 2015 Annual Report Download - page 143
Download and view the complete annual report
Please find page 143 of the 2015 HP annual report below. You can navigate through the pages in the report by either clicking on the pages listed below, or by using the keyword search tool below to find specific information within the annual report.-
 1
1 -
2
-
3
-
4
-
5
-
6
-
7
-
8
-
9
-
10
-
11
-
12
-
13
-
14
-
15
-
16
-
17
-
18
-
19
-
20
-
21
-
22
-
23
-
24
-
25
-
26
-
27
-
28
-
29
-
30
-
31
-
32
-
33
-
34
-
35
-
36
-
37
-
38
-
39
-
40
-
41
-
42
-
43
-
44
-
45
-
46
-
47
-
48
-
49
-
50
-
51
-
52
-
53
-
54
-
55
-
56
-
57
-
58
-
59
-
60
-
61
-
62
-
63
-
64
-
65
-
66
-
67
-
68
-
69
-
70
-
71
-
72
-
73
-
74
-
75
-
76
-
77
-
78
-
79
-
80
-
81
-
82
-
83
-
84
-
85
-
86
-
87
-
88
-
89
-
90
-
91
-
92
-
93
-
94
-
95
-
96
-
97
-
98
-
99
-
100
-
101
-
102
-
103
-
104
-
105
-
106
-
107
-
108
-
109
-
110
-
111
-
112
-
113
-
114
-
115
-
116
-
117
-
118
-
119
-
120
-
121
-
122
-
123
-
124
-
125
-
126
-
127
-
128
-
129
-
130
-
131
-
132
-
 133
133 -
 134
134 -
 135
135 -
 136
136 -
 137
137 -
 138
138 -
 139
139 -
 140
140 -
 141
141 -
 142
142 -
 143
143 -
 144
144 -
 145
145 -
 146
146 -
 147
147 -
 148
148 -
 149
149 -
 150
150 -
 151
151 -
 152
152 -
 153
153 -
154
-
155
-
156
-
157
-
158
-
159
-
160
-
161
-
162
-
163
-
164
-
165
-
166
-
167
-
168
-
169
-
170
-
171
-
172
-
173
-
174
-
175
-
176
-
177
-
178
-
179
-
180
-
181
-
182
-
183
-
184
-
185
-
186
-
187
-
188
-
189
-
190
-
191
-
192
-
193
-
194
-
195
-
196
-
197
-
198
-
199
-
200
-
201
-
202
-
203
-
204
-
205
-
206
-
207
-
208
-
209
-
210
-
211
-
212
-
213
-
214
-
215
-
216
-
217
-
218
-
219
-
220
-
221
-
222
-
223
-
224
-
225
-
226
-
227
-
228
-
229
-
230
-
231
-
232
-
233
-
234
-
235
-
236
-
237
-
238
-
239
-
240
 |
 |

Table of Contents
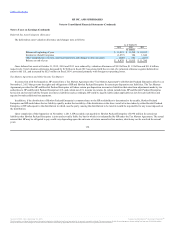
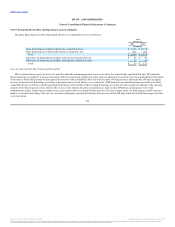
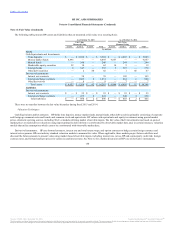
collateralized by a security interest in the underlying assets. Financing receivables also include billed receivables from operating leases. The components of
financing receivables were as follows:
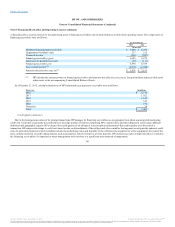
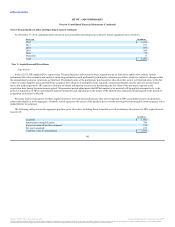
As of October 31, 2015, scheduled maturities of HP's minimum lease payments receivable were as follows:
Due to the homogenous nature of its leasing transactions, HP manages its financing receivables on an aggregate basis when assessing and monitoring
credit risk. Credit risk is generally diversified due to the large number of entities comprising HP's customer base and their dispersion across many different
industries and geographic regions. HP evaluates the credit quality of an obligor at lease inception and monitors that credit quality over the term of a
transaction. HP assigns risk ratings to each lease based on the creditworthiness of the obligor and other variables that augment or mitigate the inherent credit
risk of a particular transaction. Such variables include the underlying value and liquidity of the collateral, the essential use of the equipment, the term of the
lease, and the inclusion of credit enhancements, such as guarantees, letters of credit or security deposits. HP classifies accounts as high risk when it considers
the financing receivable to be impaired or when management believes there is a significant near-term risk of impairment.
141
Minimum lease payments receivable $ 7,000 $ 6,982
Unguaranteed residual value 217 235
Unearned income (528) (547)
Financing receivables, gross 6,689 6,670
Allowance for doubtful accounts (95) (111)
Financing receivables, net 6,594 6,559
Less: current portion(1) (2,918) (2,946)
Amounts due after one year, net(1) $ 3,676 $ 3,613
(1) HP includes the current portion in Financing receivables and amounts due after one year, net in Long-term financing receivables and
other assets in the accompanying Consolidated Balance Sheets.
2016 $ 3,176
2017 1,922
2018 1,144
2019 526
2020 194
Thereafter 38
Total $ 7,000
Source: HP INC, 10-K, December 16, 2015 Powered by Morningstar® Document Research℠
The information contained herein may not be copied, adapted or distributed and is not warranted to be accurate, complete or timely. The user assumes all risks for any damages or losses arising from any use of this information,
except to the extent such damages or losses cannot be limited or excluded by applicable law. Past financial performance is no guarantee of future results.