HP 2015 Annual Report Download - page 52
Download and view the complete annual report
Please find page 52 of the 2015 HP annual report below. You can navigate through the pages in the report by either clicking on the pages listed below, or by using the keyword search tool below to find specific information within the annual report.-
 1
1 -
2
-
3
-
4
-
5
-
6
-
7
-
8
-
9
-
10
-
11
-
12
-
13
-
14
-
15
-
16
-
17
-
18
-
19
-
20
-
21
-
22
-
23
-
24
-
25
-
26
-
27
-
28
-
29
-
30
-
31
-
32
-
33
-
34
-
35
-
36
-
37
-
38
-
39
-
40
-
41
-
 42
42 -
 43
43 -
 44
44 -
 45
45 -
 46
46 -
 47
47 -
 48
48 -
 49
49 -
 50
50 -
 51
51 -
 52
52 -
 53
53 -
 54
54 -
 55
55 -
 56
56 -
 57
57 -
 58
58 -
 59
59 -
 60
60 -
 61
61 -
 62
62 -
63
-
64
-
65
-
66
-
67
-
68
-
69
-
70
-
71
-
72
-
73
-
74
-
75
-
76
-
77
-
78
-
79
-
80
-
81
-
82
-
83
-
84
-
85
-
86
-
87
-
88
-
89
-
90
-
91
-
92
-
93
-
94
-
95
-
96
-
97
-
98
-
99
-
100
-
101
-
102
-
103
-
104
-
105
-
106
-
107
-
108
-
109
-
110
-
111
-
112
-
113
-
114
-
115
-
116
-
117
-
118
-
119
-
120
-
121
-
122
-
123
-
124
-
125
-
126
-
127
-
128
-
129
-
130
-
131
-
132
-
133
-
134
-
135
-
136
-
137
-
138
-
139
-
140
-
141
-
142
-
143
-
144
-
145
-
146
-
147
-
148
-
149
-
150
-
151
-
152
-
153
-
154
-
155
-
156
-
157
-
158
-
159
-
160
-
161
-
162
-
163
-
164
-
165
-
166
-
167
-
168
-
169
-
170
-
171
-
172
-
173
-
174
-
175
-
176
-
177
-
178
-
179
-
180
-
181
-
182
-
183
-
184
-
185
-
186
-
187
-
188
-
189
-
190
-
191
-
192
-
193
-
194
-
195
-
196
-
197
-
198
-
199
-
200
-
201
-
202
-
203
-
204
-
205
-
206
-
207
-
208
-
209
-
210
-
211
-
212
-
213
-
214
-
215
-
216
-
217
-
218
-
219
-
220
-
221
-
222
-
223
-
224
-
225
-
226
-
227
-
228
-
229
-
230
-
231
-
232
-
233
-
234
-
235
-
236
-
237
-
238
-
239
-
240
 |
 |

Table of Contents
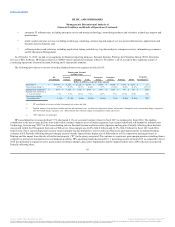
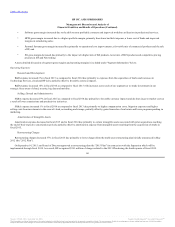
on a when-and-if-available basis is recognized ratably over the period during which such items are delivered.
For hosting or SaaS arrangements, we recognize revenue as the service is delivered, generally on a straight-line basis, over the contractual period of
performance. In hosting arrangements, we consider the rights provided to the customer (e.g. whether the customer has the contractual right to take possession
of the software at any time during the hosting period without significant penalty and the feasibility of the customer to operate or contract with another vendor
to operate the software) in determining whether the arrangement includes the sale of a software license. In hosting arrangements where software licenses are
sold, license revenue is generally recognized according to whether perpetual or term licenses are sold, when all other revenue recognition criteria are
satisfied.
We recognize revenue from fixed-price support or maintenance contracts, including extended warranty contracts and software post-contract customer
support agreements, ratably over the contract period. For certain fixed-price contracts, such as consulting arrangements, we recognize revenue as work
progresses using a proportional performance method. We estimate the total expected labor costs in order to determine the amount of revenue earned to date.
We apply a proportional performance method because reasonably dependable estimates of the labor costs applicable to various stages of a contract can be
made. On fixed-price contracts for design and build projects (to design, develop and construct software infrastructure and systems), we recognize revenue as
work progresses using the percentage-of-completion method. We use the cost-to-cost method to measure progress toward completion as determined by the
percentage of costs incurred to date compared to the total estimated costs of the project. Total project costs are subject to revision throughout the life of a
fixed-price contract. Provisions for estimated losses on fixed-price contracts are recognized in the period when such losses become known and are recorded as
a component of cost of sales. In circumstances when reasonable and reliable cost estimates for a project cannot be made we recognize revenue using the
completed contract method.
Outsourcing services revenue is generally recognized in the period when the service is provided and the amount earned is not contingent on the
occurrence of any future event. We recognize revenue using an objective measure of output for per unit-priced contracts. Revenue for fixed-price outsourcing
contracts with periodic billings is recognized on a straight-line basis if the service is provided evenly over the contract term. Provisions for estimated losses
on outsourcing arrangements are recognized in the period when such losses become probable and estimable and are recorded as a component of cost of sales.
We accrue the estimated cost of product warranties at the time we recognize revenue. We evaluate our warranty obligations on a product group basis. Our
standard product warranty terms generally include post-sales support and repairs or replacement of a product at no additional charge for a specified period of
time. While we engage in extensive product quality programs and processes, including actively monitoring and evaluating the quality of our component
suppliers, we base our estimated warranty obligation on contractual warranty terms, repair costs, product call rates, average cost per call, current period
product shipments and ongoing product failure rates, as well as specific product class failure outside of our baseline experience. Warranty terms generally
range from 90 days to three years for parts and labor, depending upon the product. Over the last three fiscal years, the annual warranty expense and actual
warranty costs have averaged approximately 2.5% and 2.7% of annual net product revenue, respectively.
50
Source: HP INC, 10-K, December 16, 2015 Powered by Morningstar® Document Research℠
The information contained herein may not be copied, adapted or distributed and is not warranted to be accurate, complete or timely. The user assumes all risks for any damages or losses arising from any use of this information,
except to the extent such damages or losses cannot be limited or excluded by applicable law. Past financial performance is no guarantee of future results.