HP 2015 Annual Report Download - page 123
Download and view the complete annual report
Please find page 123 of the 2015 HP annual report below. You can navigate through the pages in the report by either clicking on the pages listed below, or by using the keyword search tool below to find specific information within the annual report.-
 1
1 -
2
-
3
-
4
-
5
-
6
-
7
-
8
-
9
-
10
-
11
-
12
-
13
-
14
-
15
-
16
-
17
-
18
-
19
-
20
-
21
-
22
-
23
-
24
-
25
-
26
-
27
-
28
-
29
-
30
-
31
-
32
-
33
-
34
-
35
-
36
-
37
-
38
-
39
-
40
-
41
-
42
-
43
-
44
-
45
-
46
-
47
-
48
-
49
-
50
-
51
-
52
-
53
-
54
-
55
-
56
-
57
-
58
-
59
-
60
-
61
-
62
-
63
-
64
-
65
-
66
-
67
-
68
-
69
-
70
-
71
-
72
-
73
-
74
-
75
-
76
-
77
-
78
-
79
-
80
-
81
-
82
-
83
-
84
-
85
-
86
-
87
-
88
-
89
-
90
-
91
-
92
-
93
-
94
-
95
-
96
-
97
-
98
-
99
-
100
-
101
-
102
-
103
-
104
-
105
-
106
-
107
-
108
-
109
-
110
-
111
-
112
-
 113
113 -
 114
114 -
 115
115 -
 116
116 -
 117
117 -
 118
118 -
 119
119 -
 120
120 -
 121
121 -
 122
122 -
 123
123 -
 124
124 -
 125
125 -
 126
126 -
 127
127 -
 128
128 -
 129
129 -
 130
130 -
 131
131 -
 132
132 -
 133
133 -
134
-
135
-
136
-
137
-
138
-
139
-
140
-
141
-
142
-
143
-
144
-
145
-
146
-
147
-
148
-
149
-
150
-
151
-
152
-
153
-
154
-
155
-
156
-
157
-
158
-
159
-
160
-
161
-
162
-
163
-
164
-
165
-
166
-
167
-
168
-
169
-
170
-
171
-
172
-
173
-
174
-
175
-
176
-
177
-
178
-
179
-
180
-
181
-
182
-
183
-
184
-
185
-
186
-
187
-
188
-
189
-
190
-
191
-
192
-
193
-
194
-
195
-
196
-
197
-
198
-
199
-
200
-
201
-
202
-
203
-
204
-
205
-
206
-
207
-
208
-
209
-
210
-
211
-
212
-
213
-
214
-
215
-
216
-
217
-
218
-
219
-
220
-
221
-
222
-
223
-
224
-
225
-
226
-
227
-
228
-
229
-
230
-
231
-
232
-
233
-
234
-
235
-
236
-
237
-
238
-
239
-
240
 |
 |

Table of Contents
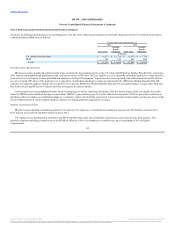
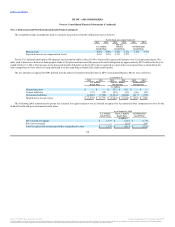
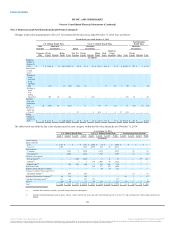
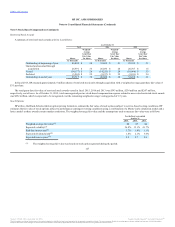
Changes in fair value measurements of Level 3 investments for the fiscal year ended October 31, 2015 were as follows:
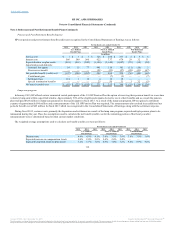
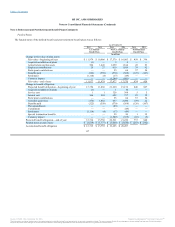
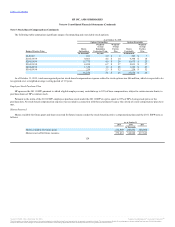
The table below sets forth the fair value of plan assets by asset category within the fair value hierarchy as of October 31, 2014.
121
Beginning
balance at
October 31,
2014 $ 7 $ 1,284 $ 3 $ 263 $1,557 $ 80 $ 51 $ 43 $ 285 $ 543 $ 79 $ 2 $1,083 $ 271 $ 1 $ 272
Actual return
on plan
assets:
Relating to
assets
still held
at the
reporting
date — (25) — (3) (28) (18) (1) — — 13 (6) 3 (9) (2) — (2)
Relating to
assets
sold
during
the period — 145 (1) — 144 — 7 (22) — — — — (15) 46 — 46
Purchases,
sales, and
settlements
(net) 24 (234) (2) — (212) — 13 — 48 14 (2) — 73 (62) (1) (63)
Transfers in
and/or out
of Level 3 — — — — — 21 — 9 (83) 1 2 37 (13) — — —
Ending
balance at
October 31,
2015 $ 31 $ 1,170 $ — $ 260 $1,461 $ 83 $ 70 $ 30 $ 250 $ 571 $ 73 $ 42 $1,119 $ 253 $ — $ 253
Asset Category:
Equity securities
U.S. $ 1,787 $ — $ — $ 1,787 $ 2,935 $ 30 $ — $ 2,965 $ — $ — $ — $ —
Non-U.S. 1,268 — — 1,268 4,050 742 80 4,872 — — — —
Debt securities
Corporate — 3,283 7 3,290 — 2,935 — 2,935 — 20 — 20
Government(1) — 2,204 — 2,204 — 1,787 — 1,787 — 22 — 22
Alternative Investments
Private Equity(2) — — 1,284 1,284 — 2 51 53 — — 271 271
Hybrids(3) — — 3 3 114 2,466 43 2,623 — — 1 1
Hedge Funds(4) — 346 263 609 — 103 285 388 — — — —
Real Estate Funds — — — — 220 277 543 1,040 — — — —
Insurance Group Annuity Contracts — — — — — 44 79 123 — — — —
Common Collective Trusts and 103-12
Investment Entities(5) — 854 — 854 — — — — — 55 — 55
Registered Investment Companies(6) 68 314 — 382 — — — — 86 1 — 87
Cash and Cash Equivalents(7) 161 66 — 227 573 — — 573 — 6 — 6
Other(8) (24) 95 — 71 79 130 2 211 (4) — — (4)
Total $ 3,260 $ 7,162 $ 1,557 $ 11,979 $ 7,971 $ 8,516 $ 1,083 $ 17,570 $ 82 $ 104 $ 272 $ 458
(1) Includes debt issued by national, state and local governments and agencies.
(2) Includes limited partnerships such as equity, buyout, venture capital, real estate and other similar funds that invest in the U.S. and internationally where foreign currencies are
hedged.
Source: HP INC, 10-K, December 16, 2015 Powered by Morningstar® Document Research℠
The information contained herein may not be copied, adapted or distributed and is not warranted to be accurate, complete or timely. The user assumes all risks for any damages or losses arising from any use of this information,
except to the extent such damages or losses cannot be limited or excluded by applicable law. Past financial performance is no guarantee of future results.