HP 2015 Annual Report Download - page 61
Download and view the complete annual report
Please find page 61 of the 2015 HP annual report below. You can navigate through the pages in the report by either clicking on the pages listed below, or by using the keyword search tool below to find specific information within the annual report.-
 1
1 -
2
-
3
-
4
-
5
-
6
-
7
-
8
-
9
-
10
-
11
-
12
-
13
-
14
-
15
-
16
-
17
-
18
-
19
-
20
-
21
-
22
-
23
-
24
-
25
-
26
-
27
-
28
-
29
-
30
-
31
-
32
-
33
-
34
-
35
-
36
-
37
-
38
-
39
-
40
-
41
-
42
-
43
-
44
-
45
-
46
-
47
-
48
-
49
-
50
-
 51
51 -
 52
52 -
 53
53 -
 54
54 -
 55
55 -
 56
56 -
 57
57 -
 58
58 -
 59
59 -
 60
60 -
 61
61 -
 62
62 -
 63
63 -
 64
64 -
 65
65 -
 66
66 -
 67
67 -
 68
68 -
 69
69 -
 70
70 -
 71
71 -
72
-
73
-
74
-
75
-
76
-
77
-
78
-
79
-
80
-
81
-
82
-
83
-
84
-
85
-
86
-
87
-
88
-
89
-
90
-
91
-
92
-
93
-
94
-
95
-
96
-
97
-
98
-
99
-
100
-
101
-
102
-
103
-
104
-
105
-
106
-
107
-
108
-
109
-
110
-
111
-
112
-
113
-
114
-
115
-
116
-
117
-
118
-
119
-
120
-
121
-
122
-
123
-
124
-
125
-
126
-
127
-
128
-
129
-
130
-
131
-
132
-
133
-
134
-
135
-
136
-
137
-
138
-
139
-
140
-
141
-
142
-
143
-
144
-
145
-
146
-
147
-
148
-
149
-
150
-
151
-
152
-
153
-
154
-
155
-
156
-
157
-
158
-
159
-
160
-
161
-
162
-
163
-
164
-
165
-
166
-
167
-
168
-
169
-
170
-
171
-
172
-
173
-
174
-
175
-
176
-
177
-
178
-
179
-
180
-
181
-
182
-
183
-
184
-
185
-
186
-
187
-
188
-
189
-
190
-
191
-
192
-
193
-
194
-
195
-
196
-
197
-
198
-
199
-
200
-
201
-
202
-
203
-
204
-
205
-
206
-
207
-
208
-
209
-
210
-
211
-
212
-
213
-
214
-
215
-
216
-
217
-
218
-
219
-
220
-
221
-
222
-
223
-
224
-
225
-
226
-
227
-
228
-
229
-
230
-
231
-
232
-
233
-
234
-
235
-
236
-
237
-
238
-
239
-
240
 |
 |

Table of Contents
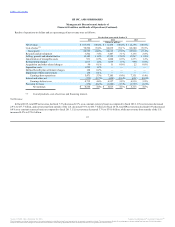
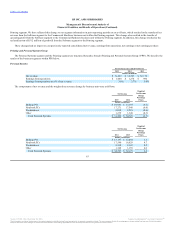
•Software net revenue decreased due to lower net revenue from licenses, support and professional services;
•HPFS net revenue decreased due primarily to lower portfolio revenue from lower average portfolio assets and lower asset management activity,
primarily in customer buyouts;
•Corporate Investments net revenue increased due to the sale of IP; and
•Personal Systems net revenue increased due to growth in commercial PCs, particularly notebooks, along with growth in consumer notebooks.
A more detailed discussion of segment revenue is included under "Segment Information" below.
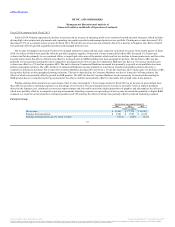
HP's gross margin increased by 0.1 percentage points for fiscal year 2015 compared with fiscal 2014. From a segment perspective, the primary factors
impacting gross margin performance are summarized as follows:
•ES gross margin increased due primarily to service delivery efficiencies and improving profit performance in underperforming contracts;
•HPFS gross margin decreased due primarily to unfavorable currency impacts, lower margin in customer buyouts, and lower portfolio margin
due to competitive pricing;
•EG gross margin decreased due primarily to a higher revenue mix of ISS products, unfavorable currency impacts, and competitive pricing;
•Printing gross margin decreased due primarily to a competitive pricing environment in hardware and unfavorable currency impacts;
•Personal Systems gross margin decreased due primarily to unfavorable currency impacts and a lower mix of commercial products, partially
offset by favorable component costs and operational cost improvements; and
•Software gross margin decreased due to a lower mix of license revenue.
HP's gross margin increased by 0.8 percentage points for fiscal year 2014 compared with fiscal 2013. From a segment perspective, the primary factors
impacting gross margin performance are summarized as follows:
•ES gross margin increased due primarily to our continued focus on service delivery efficiencies, improving profit performance in under-
performing contracts and labor savings as a result of restructuring;
•Printing gross margin increased due primarily to favorable currency impacts from the Japanese yen, continued cost structure improvements and
a favorable mix from a higher proportion of graphics and ink supplies;
•Corporate Investments gross margin increased due to the sale of IP;
59
Source: HP INC, 10-K, December 16, 2015 Powered by Morningstar® Document Research℠
The information contained herein may not be copied, adapted or distributed and is not warranted to be accurate, complete or timely. The user assumes all risks for any damages or losses arising from any use of this information,
except to the extent such damages or losses cannot be limited or excluded by applicable law. Past financial performance is no guarantee of future results.