HP 2015 Annual Report Download - page 70
Download and view the complete annual report
Please find page 70 of the 2015 HP annual report below. You can navigate through the pages in the report by either clicking on the pages listed below, or by using the keyword search tool below to find specific information within the annual report.-
 1
1 -
2
-
3
-
4
-
5
-
6
-
7
-
8
-
9
-
10
-
11
-
12
-
13
-
14
-
15
-
16
-
17
-
18
-
19
-
20
-
21
-
22
-
23
-
24
-
25
-
26
-
27
-
28
-
29
-
30
-
31
-
32
-
33
-
34
-
35
-
36
-
37
-
38
-
39
-
40
-
41
-
42
-
43
-
44
-
45
-
46
-
47
-
48
-
49
-
50
-
51
-
52
-
53
-
54
-
55
-
56
-
57
-
58
-
59
-
 60
60 -
 61
61 -
 62
62 -
 63
63 -
 64
64 -
 65
65 -
 66
66 -
 67
67 -
 68
68 -
 69
69 -
 70
70 -
 71
71 -
 72
72 -
 73
73 -
 74
74 -
 75
75 -
 76
76 -
 77
77 -
 78
78 -
 79
79 -
 80
80 -
81
-
82
-
83
-
84
-
85
-
86
-
87
-
88
-
89
-
90
-
91
-
92
-
93
-
94
-
95
-
96
-
97
-
98
-
99
-
100
-
101
-
102
-
103
-
104
-
105
-
106
-
107
-
108
-
109
-
110
-
111
-
112
-
113
-
114
-
115
-
116
-
117
-
118
-
119
-
120
-
121
-
122
-
123
-
124
-
125
-
126
-
127
-
128
-
129
-
130
-
131
-
132
-
133
-
134
-
135
-
136
-
137
-
138
-
139
-
140
-
141
-
142
-
143
-
144
-
145
-
146
-
147
-
148
-
149
-
150
-
151
-
152
-
153
-
154
-
155
-
156
-
157
-
158
-
159
-
160
-
161
-
162
-
163
-
164
-
165
-
166
-
167
-
168
-
169
-
170
-
171
-
172
-
173
-
174
-
175
-
176
-
177
-
178
-
179
-
180
-
181
-
182
-
183
-
184
-
185
-
186
-
187
-
188
-
189
-
190
-
191
-
192
-
193
-
194
-
195
-
196
-
197
-
198
-
199
-
200
-
201
-
202
-
203
-
204
-
205
-
206
-
207
-
208
-
209
-
210
-
211
-
212
-
213
-
214
-
215
-
216
-
217
-
218
-
219
-
220
-
221
-
222
-
223
-
224
-
225
-
226
-
227
-
228
-
229
-
230
-
231
-
232
-
233
-
234
-
235
-
236
-
237
-
238
-
239
-
240
 |
 |

Table of Contents
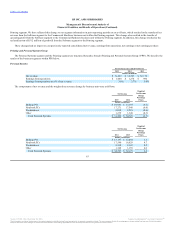
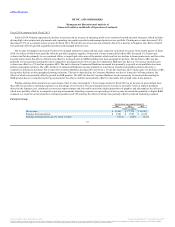
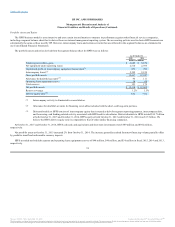
The components of the net revenue and weighted net revenue change by business unit were as follows:
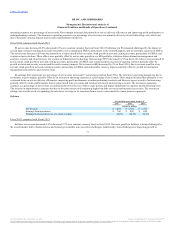
EG net revenue increased 0.7% (increased 6.3% on a constant currency basis) in fiscal 2015. The increase in EG net revenue was due primarily to growth
in ISS and from our acquisition of Aruba in May 2015, partially offset primarily by unfavorable currency impacts led by the euro and a net revenue decline in
TS. However, we continued to experience challenges due to market trends, including the transition to cloud computing, as well as product and technology
transitions, along with a highly competitive pricing environment.
ISS net revenue increased 8% as a result of higher average unit prices ("AUPs) and unit volume growth. The increase in AUP's was across the server
portfolio, primarily driven by higher option attach rates for memory, processors and hard drives and a mix shift to high-end new generation HP ProLiant
servers. The unit volume growth was primarily due to shipment increases in rack and density optimized server products. Networking net revenue increased
8% due primarily to revenue from Aruba, which resulted in higher revenue from wireless local area network ("WLAN") products, the effect of which was
partially offset by competitive pricing pressures, particularly in the China market. Storage net revenue decreased 4% as a result of a decline in traditional
storage products, the effect of which was partially offset by growth in Converged Storage solutions from the 3PAR StoreServ products,
68
Technology Services $ 7,662 $ 8,375 (2.6)
Storage 3,180 3,316 (0.5)
Business Critical Systems 807 929 (0.4)
Networking 2,846 2,629 0.8
Industry Standard Servers 13,412 12,474 3.4
Total Enterprise Group $ 27,907 $ 27,723 0.7
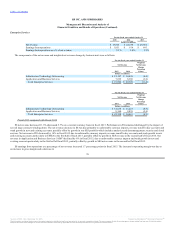
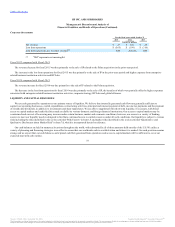
Technology Services $ 8,375 $ 8,710 (1.2)
Storage 3,316 3,475 (0.6)
Business Critical Systems 929 1,190 (0.9)
Networking 2,629 2,526 0.4
Industry Standard Servers 12,474 12,102 1.3
Total Enterprise Group $ 27,723 $ 28,803 (1.0)
Source: HP INC, 10-K, December 16, 2015 Powered by Morningstar® Document Research℠
The information contained herein may not be copied, adapted or distributed and is not warranted to be accurate, complete or timely. The user assumes all risks for any damages or losses arising from any use of this information,
except to the extent such damages or losses cannot be limited or excluded by applicable law. Past financial performance is no guarantee of future results.