HP 2015 Annual Report Download - page 111
Download and view the complete annual report
Please find page 111 of the 2015 HP annual report below. You can navigate through the pages in the report by either clicking on the pages listed below, or by using the keyword search tool below to find specific information within the annual report.-
 1
1 -
2
-
3
-
4
-
5
-
6
-
7
-
8
-
9
-
10
-
11
-
12
-
13
-
14
-
15
-
16
-
17
-
18
-
19
-
20
-
21
-
22
-
23
-
24
-
25
-
26
-
27
-
28
-
29
-
30
-
31
-
32
-
33
-
34
-
35
-
36
-
37
-
38
-
39
-
40
-
41
-
42
-
43
-
44
-
45
-
46
-
47
-
48
-
49
-
50
-
51
-
52
-
53
-
54
-
55
-
56
-
57
-
58
-
59
-
60
-
61
-
62
-
63
-
64
-
65
-
66
-
67
-
68
-
69
-
70
-
71
-
72
-
73
-
74
-
75
-
76
-
77
-
78
-
79
-
80
-
81
-
82
-
83
-
84
-
85
-
86
-
87
-
88
-
89
-
90
-
91
-
92
-
93
-
94
-
95
-
96
-
97
-
98
-
99
-
100
-
 101
101 -
 102
102 -
 103
103 -
 104
104 -
 105
105 -
 106
106 -
 107
107 -
 108
108 -
 109
109 -
 110
110 -
 111
111 -
 112
112 -
 113
113 -
 114
114 -
 115
115 -
 116
116 -
 117
117 -
 118
118 -
 119
119 -
 120
120 -
 121
121 -
122
-
123
-
124
-
125
-
126
-
127
-
128
-
129
-
130
-
131
-
132
-
133
-
134
-
135
-
136
-
137
-
138
-
139
-
140
-
141
-
142
-
143
-
144
-
145
-
146
-
147
-
148
-
149
-
150
-
151
-
152
-
153
-
154
-
155
-
156
-
157
-
158
-
159
-
160
-
161
-
162
-
163
-
164
-
165
-
166
-
167
-
168
-
169
-
170
-
171
-
172
-
173
-
174
-
175
-
176
-
177
-
178
-
179
-
180
-
181
-
182
-
183
-
184
-
185
-
186
-
187
-
188
-
189
-
190
-
191
-
192
-
193
-
194
-
195
-
196
-
197
-
198
-
199
-
200
-
201
-
202
-
203
-
204
-
205
-
206
-
207
-
208
-
209
-
210
-
211
-
212
-
213
-
214
-
215
-
216
-
217
-
218
-
219
-
220
-
221
-
222
-
223
-
224
-
225
-
226
-
227
-
228
-
229
-
230
-
231
-
232
-
233
-
234
-
235
-
236
-
237
-
238
-
239
-
240
 |
 |

Table of Contents
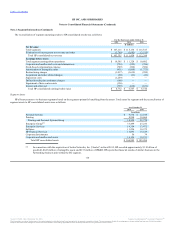
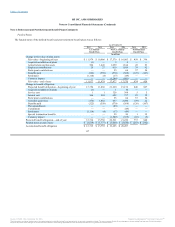
In connection with the Separation, effective at the beginning of the fourth quarter of fiscal 2015, HP implemented an organizational change which
resulted in the transfer of marketing optimization solutions business from the Software segment to the Commercial Hardware business unit within the Printing
segment. HP has reflected this change to its segment information in prior reporting periods on an as-if basis, which resulted in the transfer of net revenue from
the Software segment to the Commercial Hardware business unit within the Printing segment. This change also resulted in the transfer of operating profit from
the Software segment to the Commercial Hardware business unit within the Printing segment. In addition, this change resulted in the reclassification of $512
million of goodwill from the Software segment to the Printing segment.
These changes had no impact on HP's previously reported consolidated net revenue, earnings from operations, net earnings or net EPS.
109
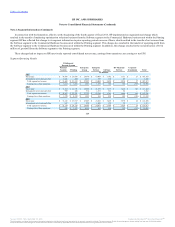
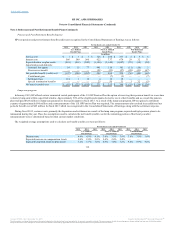
Net revenue $ 30,438 $ 20,938 $ 26,670 $ 19,009 $ 3,142 $ 3,131 $ 27 $ 103,355
Intersegment net revenue and other 1,031 294 1,237 797 316 85 — 3,760
Total segment net revenue $ 31,469 $ 21,232 $ 27,907 $ 19,806 $ 3,458 $ 3,216 $ 27 $ 107,115
Earnings (loss) from operations $ 1,064 $ 3,865 $ 3,981 $ 1,051 $ 760 $ 349 $ (565) $ 10,505
Net revenue $ 33,304 $ 22,951 $ 26,809 $ 21,297 $ 3,375 $ 3,416 $ 302 $ 111,454
Intersegment net revenue and other 999 260 914 1,101 326 82 — 3,682
Total segment net revenue $ 34,303 $ 23,211 $ 27,723 $ 22,398 $ 3,701 $ 3,498 $ 302 $ 115,136
Earnings (loss) from operations $ 1,270 $ 4,229 $ 3,995 $ 816 $ 828 $ 389 $ (199) $ 11,328
Net revenue $ 31,232 $ 23,917 $ 27,045 $ 23,041 $ 3,469 $ 3,570 $ 24 $ 112,298
Intersegment net revenue and other 947 211 958 1,020 320 59 — 3,515
Total segment net revenue $ 32,179 $ 24,128 $ 28,003 $ 24,061 $ 3,789 $ 3,629 $ 24 $ 115,813
Earnings (loss) from operations $ 980 $ 3,953 $ 4,245 $ 693 $ 848 $ 399 $ (316) $ 10,802
Source: HP INC, 10-K, December 16, 2015 Powered by Morningstar® Document Research℠
The information contained herein may not be copied, adapted or distributed and is not warranted to be accurate, complete or timely. The user assumes all risks for any damages or losses arising from any use of this information,
except to the extent such damages or losses cannot be limited or excluded by applicable law. Past financial performance is no guarantee of future results.