HP 2015 Annual Report Download - page 76
Download and view the complete annual report
Please find page 76 of the 2015 HP annual report below. You can navigate through the pages in the report by either clicking on the pages listed below, or by using the keyword search tool below to find specific information within the annual report.-
 1
1 -
2
-
3
-
4
-
5
-
6
-
7
-
8
-
9
-
10
-
11
-
12
-
13
-
14
-
15
-
16
-
17
-
18
-
19
-
20
-
21
-
22
-
23
-
24
-
25
-
26
-
27
-
28
-
29
-
30
-
31
-
32
-
33
-
34
-
35
-
36
-
37
-
38
-
39
-
40
-
41
-
42
-
43
-
44
-
45
-
46
-
47
-
48
-
49
-
50
-
51
-
52
-
53
-
54
-
55
-
56
-
57
-
58
-
59
-
60
-
61
-
62
-
63
-
64
-
65
-
 66
66 -
 67
67 -
 68
68 -
 69
69 -
 70
70 -
 71
71 -
 72
72 -
 73
73 -
 74
74 -
 75
75 -
 76
76 -
 77
77 -
 78
78 -
 79
79 -
 80
80 -
 81
81 -
 82
82 -
 83
83 -
 84
84 -
 85
85 -
 86
86 -
87
-
88
-
89
-
90
-
91
-
92
-
93
-
94
-
95
-
96
-
97
-
98
-
99
-
100
-
101
-
102
-
103
-
104
-
105
-
106
-
107
-
108
-
109
-
110
-
111
-
112
-
113
-
114
-
115
-
116
-
117
-
118
-
119
-
120
-
121
-
122
-
123
-
124
-
125
-
126
-
127
-
128
-
129
-
130
-
131
-
132
-
133
-
134
-
135
-
136
-
137
-
138
-
139
-
140
-
141
-
142
-
143
-
144
-
145
-
146
-
147
-
148
-
149
-
150
-
151
-
152
-
153
-
154
-
155
-
156
-
157
-
158
-
159
-
160
-
161
-
162
-
163
-
164
-
165
-
166
-
167
-
168
-
169
-
170
-
171
-
172
-
173
-
174
-
175
-
176
-
177
-
178
-
179
-
180
-
181
-
182
-
183
-
184
-
185
-
186
-
187
-
188
-
189
-
190
-
191
-
192
-
193
-
194
-
195
-
196
-
197
-
198
-
199
-
200
-
201
-
202
-
203
-
204
-
205
-
206
-
207
-
208
-
209
-
210
-
211
-
212
-
213
-
214
-
215
-
216
-
217
-
218
-
219
-
220
-
221
-
222
-
223
-
224
-
225
-
226
-
227
-
228
-
229
-
230
-
231
-
232
-
233
-
234
-
235
-
236
-
237
-
238
-
239
-
240
 |
 |

Table of Contents
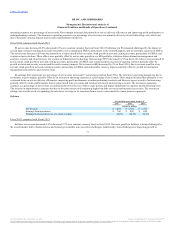
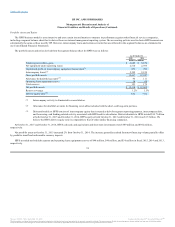
The HPFS business model is asset intensive and uses certain internal metrics to measure its performance against other financial services companies,
including a segment balance sheet that is derived from our internal management reporting system. The accounting policies used to derive HPFS amounts are
substantially the same as those used by HP. However, intercompany loans and certain accounts that are reflected in the segment balances are eliminated in
our Consolidated Financial Statements.
The portfolio assets and ratios derived from the segment balance sheet for HPFS were as follows:
At October 31, 2015 and October 31, 2014, HPFS cash and cash equivalents and short term investments were $589 million and $952 million,
respectively.
Net portfolio assets at October 31, 2015 increased 2% from October 31, 2014. The increase generally resulted from new financing volume partially offset
by portfolio runoff and unfavorable currency impacts.
HPFS recorded net bad debt expense and operating lease equipment reserves of $46 million, $40 million, and $50 million in fiscal 2015, 2014 and 2013,
respectively.
74
Financing receivables, gross $ 6,689 $ 6,670
Net equipment under operating leases 2,710 2,595
Capitalized profit on intercompany equipment transactions(1) 873 783
Intercompany leases(1) 2,195 2,199
Gross portfolio assets 12,467 12,247
Allowance for doubtful accounts(2) 95 111
Operating lease equipment reserve 58 68
Total reserves 153 179
Net portfolio assets $ 12,314 $ 12,068
Reserve coverage 1.2% 1.5%
Debt-to-equity ratio(3) 7.0x 7.0x
(1) Intercompany activity is eliminated in consolidation.
(2) Allowance for doubtful accounts for financing receivables includes both the short- and long-term portions.
(3) Debt attributable to HPFS consists of intercompany equity that is treated as debt for segment reporting purposes, intercompany debt,
and borrowing- and funding-related activity associated with HPFS and its subsidiaries. Debt attributable to HPFS totaled $10.7 billion
at both October 31, 2015 and October 31, 2014. HPFS equity at both October 31, 2015 and October 31, 2014 was $1.5 billion. We
believe the HPFS debt-to-equity ratio is comparable to that of other similar financing companies.
Source: HP INC, 10-K, December 16, 2015 Powered by Morningstar® Document Research℠
The information contained herein may not be copied, adapted or distributed and is not warranted to be accurate, complete or timely. The user assumes all risks for any damages or losses arising from any use of this information,
except to the extent such damages or losses cannot be limited or excluded by applicable law. Past financial performance is no guarantee of future results.