Google 2009 Annual Report Download - page 94
Download and view the complete annual report
Please find page 94 of the 2009 Google annual report below. You can navigate through the pages in the report by either clicking on the pages listed below, or by using the keyword search tool below to find specific information within the annual report.-
 1
1 -
2
-
3
-
4
-
5
-
6
-
7
-
8
-
9
-
10
-
11
-
12
-
13
-
14
-
15
-
16
-
17
-
18
-
19
-
20
-
21
-
22
-
23
-
24
-
25
-
26
-
27
-
28
-
29
-
30
-
31
-
32
-
33
-
34
-
35
-
36
-
37
-
38
-
39
-
40
-
41
-
42
-
43
-
44
-
45
-
46
-
47
-
48
-
49
-
50
-
51
-
52
-
53
-
54
-
55
-
56
-
57
-
58
-
59
-
60
-
61
-
62
-
63
-
64
-
65
-
66
-
67
-
68
-
69
-
70
-
71
-
72
-
73
-
74
-
75
-
76
-
77
-
78
-
79
-
80
-
81
-
82
-
83
-
 84
84 -
 85
85 -
 86
86 -
 87
87 -
 88
88 -
 89
89 -
 90
90 -
 91
91 -
 92
92 -
 93
93 -
 94
94 -
 95
95 -
 96
96 -
 97
97 -
 98
98 -
 99
99 -
 100
100 -
 101
101 -
 102
102 -
 103
103 -
 104
104 -
105
-
106
-
107
-
108
-
109
-
110
-
111
-
112
-
113
-
114
-
115
-
116
-
117
-
118
-
119
-
120
-
121
-
122
-
123
-
124
-
125
-
126
-
127
-
128
-
129
-
130
-
131
-
132
 |
 |

Google Inc.
NOTES TO CONSOLIDATED FINANCIAL STATEMENTS—(Continued)
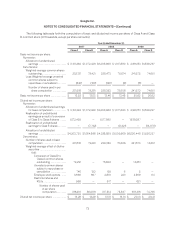
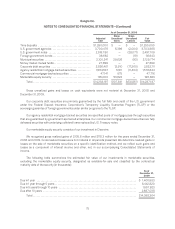
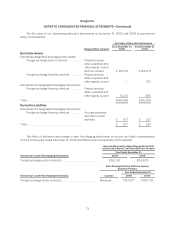
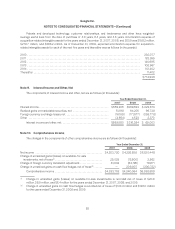
The following tables presents gross unrealized losses and fair values for those investments that were in an
unrealized loss position as of December 31, 2008 and 2009, aggregated by investment category and the length of
time that individual securities have been in a continuous loss position (in thousands):
As of December 31, 2008
Less than 12 Months
Security Description Fair Value Unrealized
Loss
U.S. government agencies ........................................................ $183,054 $ (91)
Municipal securities .............................................................. 274,042 (3,352)
Corporate debt securities ......................................................... 199,828 (172)
Total ....................................................................... $656,924 $ (3,615)
As of December 31, 2009
Less than 12 Months
Security Description Fair Value Unrealized
Loss
U.S. government agencies ...................................................... $ 1,273,165 $ (2,004)
U.S. government notes ......................................................... 2,491,709 (28,071)
Foreign government bonds ..................................................... 36,643 (19)
Municipal securities ............................................................ 60,212 (93)
Corporate debt securities ....................................................... 1,174,769 (17,260)
Agency mortgage-backed securities ............................................. 1,040,486 (11,404)
Total ..................................................................... $6,076,984 $(58,851)
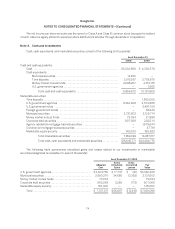
As of December 31, 2008 and 2009, we did not have any investments in marketable securities that were in
an unrealized loss position for 12 months or greater.
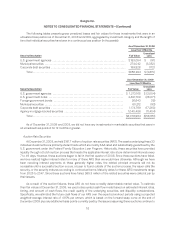
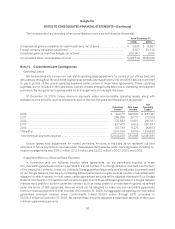
Auction Rate Securities
At December 31, 2009, we held $181.7 million of auction rate securities (ARS). The assets underlying these 33
individual investments are primarily student loans which are mostly AAA rated and substantially guaranteed by the
U.S. government under the Federal Family Education Loan Program. Historically, these securities have provided
liquidity through a Dutch auction process that resets the applicable interest rate at pre-determined intervals every
7 to 49 days. However, these auctions began to fail in the first quarter of 2008. Since these auctions have failed,
we have realized higher interest rates for many of these ARS than we would have otherwise. Although we have
been receiving interest payments at these generally higher rates, the related principal amounts will not be
accessible until a successful auction occurs, a buyer is found outside of the auction process, the issuer calls the
security, or the security matures according to contractual terms. Maturity dates for these ARS investments range
from 2025 to 2047. Since these auctions have failed, $65.3 million of the related securities were called at par by
their issuers.
As a result of the auction failures, these ARS do not have a readily determinable market value. To estimate
their fair values at December 31, 2009, we used a discounted cash flow model based on estimated interest rates,
timing, and amount of cash flows, the credit quality of the underlying securities, and illiquidity considerations.
Specifically, we estimated the future cash flows of our ARS over the expected workout periods using a projected
weighted-average interest rate of 4.15% per annum, which is based on the forward swap curve at the end of
December 2009 plus any additional basis points currently paid by the issuers assuming these auctions continue to
76