Google 2009 Annual Report Download - page 65
Download and view the complete annual report
Please find page 65 of the 2009 Google annual report below. You can navigate through the pages in the report by either clicking on the pages listed below, or by using the keyword search tool below to find specific information within the annual report.-
 1
1 -
2
-
3
-
4
-
5
-
6
-
7
-
8
-
9
-
10
-
11
-
12
-
13
-
14
-
15
-
16
-
17
-
18
-
19
-
20
-
21
-
22
-
23
-
24
-
25
-
26
-
27
-
28
-
29
-
30
-
31
-
32
-
33
-
34
-
35
-
36
-
37
-
38
-
39
-
40
-
41
-
42
-
43
-
44
-
45
-
46
-
47
-
48
-
49
-
50
-
51
-
52
-
53
-
54
-
 55
55 -
 56
56 -
 57
57 -
 58
58 -
 59
59 -
 60
60 -
 61
61 -
 62
62 -
 63
63 -
 64
64 -
 65
65 -
 66
66 -
 67
67 -
 68
68 -
 69
69 -
 70
70 -
 71
71 -
 72
72 -
 73
73 -
 74
74 -
 75
75 -
76
-
77
-
78
-
79
-
80
-
81
-
82
-
83
-
84
-
85
-
86
-
87
-
88
-
89
-
90
-
91
-
92
-
93
-
94
-
95
-
96
-
97
-
98
-
99
-
100
-
101
-
102
-
103
-
104
-
105
-
106
-
107
-
108
-
109
-
110
-
111
-
112
-
113
-
114
-
115
-
116
-
117
-
118
-
119
-
120
-
121
-
122
-
123
-
124
-
125
-
126
-
127
-
128
-
129
-
130
-
131
-
132
 |
 |

General and administrative expenses decreased $135.3 million from 2008 to 2009. This decrease was primarily
related to the settlement agreement with the Authors Guild and the Association of American Publishers (AAP) under
which we recognized $95.1 million of expense in 2008. In addition, consulting costs decreased $59.6 million.
General and administrative expenses increased $523.3 million from 2007 to 2008. This increase was
primarily related to an increase in professional services of $243.0 million, the majority of which were related to
legal costs, including the aforementioned legal settlement with the Authors Guild and the AAP. In addition, there
was an increase in labor and facilities related costs of $137.8 million, primarily as a result of a 9% increase in
general administrative headcount from 2007 to 2008, and an increase in bad debt expense of $96.1 million due to
the general economic downturn.
Stock-Based Compensation
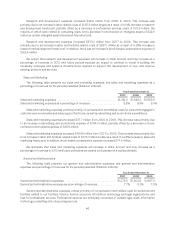
The following table presents our stock-based compensation and stock-based compensation as a percentage
of revenues for the periods presented (dollars in millions):
Year Ended December 31,
2007 2008 2009
Stock-based compensation ................................................. $868.6 $1,119.8 $1,164.1
Stock-based compensation as a percentage of revenues ....................... 5.2% 5.1% 4.9%
In March 2009, we completed an offer to exchange certain employee stock options issued under Google’s
2004 Stock Plan (the Exchange). Certain previously granted options were exchanged for new stock options with a
lower exercise price granted on a one-for-one basis. Options for an aggregate of approximately 7.6 million shares
of Google’s Class A common stock were exchanged. Options granted pursuant to the Exchange have an exercise
price of $308.57 per share, the closing price of Google’s Class A common stock as reported by The Nasdaq Global
Select Market on March 6, 2009. Options granted pursuant to the Exchange have a new vesting schedule
determined by adding 12 months to each vesting date under the exchanged options’ original vesting schedule. In
addition, new options will vest no sooner than six months after the date of the Exchange. The Exchange resulted in
a modification charge of approximately $360 million which is being recognized over the vesting periods of the new
options. These vesting periods range from six months to approximately five years. We recorded approximately
$103 million of the modification charge in 2009.
Stock-based compensation increased $44.3 million from 2008 to 2009. This increase was largely due to the
modification charge recognized in 2009, as well as additional stock awards issued to existing and new employees.
This increase was partially offset by lower stock-based compensation expense as a result of a significant amount
of equity awards which fully vested in 2008, as well as an increase to the overall estimated forfeiture rate.
Stock-based compensation increased $251.2 million from 2007 to 2008. This increase was primarily due to
additional stock awards issued to existing and new employees.
Impairment of Equity Investments
In the fourth quarter of 2008, we recorded a non-cash impairment charge of $1.09 billion, which was
primarily comprised of $726.0 million and $355.0 million related to our investments in America Online, Inc. (AOL)
and Clearwire Corporation (Clearwire). We subsequently sold our investment in AOL in the second quarter of 2009.
See Note 3 of Notes to Consolidated Financial Statements included in this Annual Report on Form 10-K.
Interest Income and Other, Net
Interest income and other, net decreased $247.4 million from 2008 to 2009. This decrease was primarily
driven by a decrease in interest income of $159.9 million due to lower yields on our cash and investment balances
and an increase in net foreign exchange related costs of $87.9 million primarily due to more hedging activities
under our foreign exchange risk management program.
47