Google 2009 Annual Report Download - page 80
Download and view the complete annual report
Please find page 80 of the 2009 Google annual report below. You can navigate through the pages in the report by either clicking on the pages listed below, or by using the keyword search tool below to find specific information within the annual report.-
 1
1 -
2
-
3
-
4
-
5
-
6
-
7
-
8
-
9
-
10
-
11
-
12
-
13
-
14
-
15
-
16
-
17
-
18
-
19
-
20
-
21
-
22
-
23
-
24
-
25
-
26
-
27
-
28
-
29
-
30
-
31
-
32
-
33
-
34
-
35
-
36
-
37
-
38
-
39
-
40
-
41
-
42
-
43
-
44
-
45
-
46
-
47
-
48
-
49
-
50
-
51
-
52
-
53
-
54
-
55
-
56
-
57
-
58
-
59
-
60
-
61
-
62
-
63
-
64
-
65
-
66
-
67
-
68
-
69
-
 70
70 -
 71
71 -
 72
72 -
 73
73 -
 74
74 -
 75
75 -
 76
76 -
 77
77 -
 78
78 -
 79
79 -
 80
80 -
 81
81 -
 82
82 -
 83
83 -
 84
84 -
 85
85 -
 86
86 -
 87
87 -
 88
88 -
 89
89 -
 90
90 -
91
-
92
-
93
-
94
-
95
-
96
-
97
-
98
-
99
-
100
-
101
-
102
-
103
-
104
-
105
-
106
-
107
-
108
-
109
-
110
-
111
-
112
-
113
-
114
-
115
-
116
-
117
-
118
-
119
-
120
-
121
-
122
-
123
-
124
-
125
-
126
-
127
-
128
-
129
-
130
-
131
-
132
 |
 |

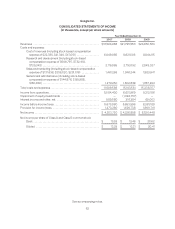
Google Inc.
CONSOLIDATED STATEMENTS OF INCOME
(In thousands, except per share amounts)
Year Ended December 31,
2007 2008 2009
Revenues .................................................. $16,593,986 $21,795,550 $23,650,563
Costs and expenses:
Cost of revenues (including stock-based compensation
expense of $22,335, $41,340, $47,051) ................. 6,649,085 8,621,506 8,844,115
Research and development (including stock-based
compensation expense of $569,797, $732,418,
$725,342) ........................................... 2,119,985 2,793,192 2,843,027
Sales and marketing (including stock-based compensation
expense of $131,638, $206,020, $231,019) ............. 1,461,266 1,946,244 1,983,941
General and administrative (including stock-based
compensation expense of $144,876, $139,988,
$160,642) ........................................... 1,279,250 1,802,639 1,667,294
Total costs and expenses ..................................... 11,509,586 15,163,581 15,338,377
Income from operations ...................................... 5,084,400 6,631,969 8,312,186
Impairment of equity investments ............................. — (1,094,757) —
Interest income and other, net ................................ 589,580 316,384 69,003
Income before income taxes .................................. 5,673,980 5,853,596 8,381,189
Provision for income taxes ................................... 1,470,260 1,626,738 1,860,741
Net income ................................................. $ 4,203,720 $ 4,226,858 $ 6,520,448
Net income per share of Class A and Class B common stock:
Basic .................................................. $ 13.53 $ 13.46 $ 20.62
Diluted ................................................ $ 13.29 $ 13.31 $ 20.41
See accompanying notes.
62