Google 2009 Annual Report Download - page 58
Download and view the complete annual report
Please find page 58 of the 2009 Google annual report below. You can navigate through the pages in the report by either clicking on the pages listed below, or by using the keyword search tool below to find specific information within the annual report.-
 1
1 -
2
-
3
-
4
-
5
-
6
-
7
-
8
-
9
-
10
-
11
-
12
-
13
-
14
-
15
-
16
-
17
-
18
-
19
-
20
-
21
-
22
-
23
-
24
-
25
-
26
-
27
-
28
-
29
-
30
-
31
-
32
-
33
-
34
-
35
-
36
-
37
-
38
-
39
-
40
-
41
-
42
-
43
-
44
-
45
-
46
-
47
-
 48
48 -
 49
49 -
 50
50 -
 51
51 -
 52
52 -
 53
53 -
 54
54 -
 55
55 -
 56
56 -
 57
57 -
 58
58 -
 59
59 -
 60
60 -
 61
61 -
 62
62 -
 63
63 -
 64
64 -
 65
65 -
 66
66 -
 67
67 -
 68
68 -
69
-
70
-
71
-
72
-
73
-
74
-
75
-
76
-
77
-
78
-
79
-
80
-
81
-
82
-
83
-
84
-
85
-
86
-
87
-
88
-
89
-
90
-
91
-
92
-
93
-
94
-
95
-
96
-
97
-
98
-
99
-
100
-
101
-
102
-
103
-
104
-
105
-
106
-
107
-
108
-
109
-
110
-
111
-
112
-
113
-
114
-
115
-
116
-
117
-
118
-
119
-
120
-
121
-
122
-
123
-
124
-
125
-
126
-
127
-
128
-
129
-
130
-
131
-
132
 |
 |
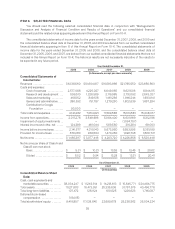
Both seasonal fluctuations in internet usage and traditional retail seasonality have affected, and are likely to
continue to affect, our business. Internet usage generally slows during the summer months, and commercial
queries typically increase significantly in the fourth quarter of each year. These seasonal trends have caused, and
will likely continue to cause, fluctuations in our quarterly results, including fluctuations in sequential revenues, as
well as paid click and average cost-per-click growth rates.
The operating margin we realize on revenues generated from ads placed on our Google Network members’
web sites through our AdSense program is significantly lower than the operating margin we realize from revenues
generated from ads placed on our web sites because most of the advertiser fees from ads served on Google
Network members’ web sites are shared with our Google Network members. For the past five years, growth in
advertising revenues from our web sites has generally exceeded that from our Google Network members’ web
sites. This trend has had a positive impact on our operating margins, and we expect that this will continue for the
foreseeable future, although the relative rate of growth in revenues from our web sites compared to the rate of
growth in revenues from our Google Network members’ web sites may vary over time.
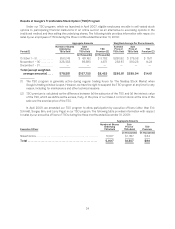
We continue to invest in building the necessary employee and systems infrastructures required to manage
our growth and develop and promote our products and services, and this may cause our operating margins to
decrease. We have generally experienced and expect to continue to experience growth in our operations as we
build our research and development programs, expand our base of users, advertisers, Google Network members,
and content providers, and increase our presence in international markets. Also, we have acquired and expect to
continue to acquire businesses and other assets from time to time. In particular, we expect to increase the number
of acquisitions we make in 2010 compared to 2009. These acquisitions generally enhance the breadth and depth
of our expertise in engineering and other functional areas, our technologies, and our product offerings. Our full-
time employee headcount was 20,222 at December 31, 2008 and 19,835 at December 31, 2009. In the past few
quarters, we made efforts to improve the discipline of our hiring process and to focus on better managing our
expense growth. However, we expect to continue to invest in our business, including significantly increasing our
hiring rate, and this may cause our operating margins to decrease.
We expect our cost of revenues will increase in dollars and may increase as a percentage of revenues in future
periods, primarily as a result of forecasted increases in traffic acquisition costs, data center costs, and credit card
and other transaction fees, content acquisition costs, and other costs, including the costs of the mobile phones
that we sell. In particular, traffic acquisition costs as a percentage of advertising revenues may increase in the
future if we are unable to continue to improve the monetization or generation of revenues from traffic on our web
sites and our Google Network members’ web sites, including with those members to whom we have guaranteed
minimum revenue share payments.
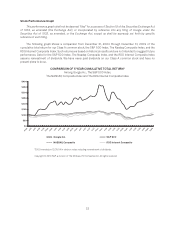
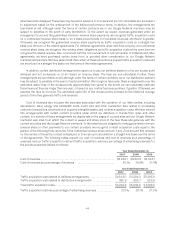
Our international revenues have grown as a percentage of our total revenues from 51% 2008 to 53% in
2009. This increase in the portion of our revenues derived from international markets results largely from
increased acceptance of our advertising programs, and our continued progress in developing localized versions of
our products in these international markets. The increase in the proportion of international revenues derived from
international markets continues to increase our exposure to fluctuations in foreign currency to U.S. dollar
exchange rates. For example, in 2009, the general strengthening of the U.S. dollar relative to foreign currencies
(primarily the Euro and the British pound) had an unfavorable impact on our revenues. We have a foreign exchange
risk management program that is designed to reduce our exposure to fluctuations in foreign currencies. However,
this program will not fully offset the effect of fluctuations on our revenues and earnings.
Recent Development
In January 2010, we announced our decision to review our business operations in China and that we are
discussing with the Chinese government the basis on which we could operate an unfiltered search engine pursuant
to local law. These discussions may result in our shutting down Google.cn, and potentially our offices in China. The
ultimate outcome, including any related exit costs we might incur, is unknown at this time.
40