Google 2009 Annual Report Download - page 64
Download and view the complete annual report
Please find page 64 of the 2009 Google annual report below. You can navigate through the pages in the report by either clicking on the pages listed below, or by using the keyword search tool below to find specific information within the annual report.-
 1
1 -
2
-
3
-
4
-
5
-
6
-
7
-
8
-
9
-
10
-
11
-
12
-
13
-
14
-
15
-
16
-
17
-
18
-
19
-
20
-
21
-
22
-
23
-
24
-
25
-
26
-
27
-
28
-
29
-
30
-
31
-
32
-
33
-
34
-
35
-
36
-
37
-
38
-
39
-
40
-
41
-
42
-
43
-
44
-
45
-
46
-
47
-
48
-
49
-
50
-
51
-
52
-
53
-
 54
54 -
 55
55 -
 56
56 -
 57
57 -
 58
58 -
 59
59 -
 60
60 -
 61
61 -
 62
62 -
 63
63 -
 64
64 -
 65
65 -
 66
66 -
 67
67 -
 68
68 -
 69
69 -
 70
70 -
 71
71 -
 72
72 -
 73
73 -
 74
74 -
75
-
76
-
77
-
78
-
79
-
80
-
81
-
82
-
83
-
84
-
85
-
86
-
87
-
88
-
89
-
90
-
91
-
92
-
93
-
94
-
95
-
96
-
97
-
98
-
99
-
100
-
101
-
102
-
103
-
104
-
105
-
106
-
107
-
108
-
109
-
110
-
111
-
112
-
113
-
114
-
115
-
116
-
117
-
118
-
119
-
120
-
121
-
122
-
123
-
124
-
125
-
126
-
127
-
128
-
129
-
130
-
131
-
132
 |
 |

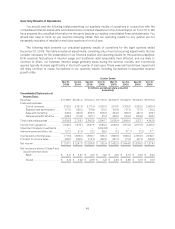
Research and development expenses increased $49.8 million from 2008 to 2009. This increase was
primarily due to an increase in labor related costs of $138.3 million largely as a result of a 14% increase in research
and development headcount, partially offset by a decrease in professional services costs of $73.8 million, the
majority of which were related to consulting costs, and a decrease in amortization of intangible assets of $22.6
million as certain intangible assets have been fully amortized.
Research and development expenses increased $673.2 million from 2007 to 2008. This increase was
primarily due to an increase in labor and facilities related costs of $387.1 million as a result of a 25% increase in
research and development headcount. In addition, there was an increase in stock-based compensation expense of
$162.6 million.
We expect that research and development expenses will increase in dollar amount and may increase as a
percentage of revenues in 2010 and future periods because we expect to continue to invest in building the
necessary employee and systems infrastructures required to support the development of new, and improve
existing, products and services.
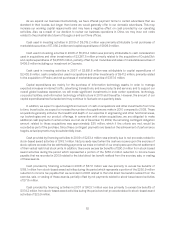
Sales and Marketing
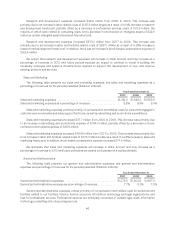
The following table presents our sales and marketing expenses, and sales and marketing expenses as a
percentage of revenues for the periods presented (dollars in millions):
Year Ended December 31,
2007 2008 2009
Sales and marketing expenses ............................................ $1,461.3 $1,946.2 $1,983.9
Sales and marketing expenses as a percentage of revenues ................... 8.8% 8.9% 8.4%
Sales and marketing expenses consist primarily of compensation and related costs for personnel engaged in
customer service and sales and sales support functions, as well as advertising and promotional expenditures.
Sales and marketing expenses increased $37.7 million from 2008 to 2009. This increase was primarily due
to an increase in advertising and promotional expense of $104.0 million, partially offset by a decrease in travel,
conference and related expenses of $49.8 million.
Sales and marketing expenses increased $484.9 million from 2007 to 2008. This increase was primarily due
to an increase in labor and facilities related costs of $373.1 million mostly as a result of a 20% increase in sales and
marketing headcount. In addition, stock-based compensation expense increased $74.4 million.
We anticipate that sales and marketing expenses will increase in dollar amount and may increase as a
percentage of revenues in 2010 and future periods as we expand our business on a worldwide basis.
General and Administrative
The following table presents our general and administrative expenses, and general and administrative
expenses as a percentage of revenues for the periods presented (dollars in millions):
Year Ended December 31,
2007 2008 2009
General and administrative expenses ...................................... $1,279.3 $1,802.6 $1,667.3
General and administrative expenses as a percentage of revenues ............. 7.7% 8.3% 7.0%
General and administrative expenses consist primarily of compensation and related costs for personnel and
facilities related to our facilities, finance, human resources, information technology and legal organizations, and
fees for professional services. Professional services are principally comprised of outside legal, audit, information
technology consulting, and outsourcing services.
46