Google 2009 Annual Report Download - page 109
Download and view the complete annual report
Please find page 109 of the 2009 Google annual report below. You can navigate through the pages in the report by either clicking on the pages listed below, or by using the keyword search tool below to find specific information within the annual report.-
 1
1 -
2
-
3
-
4
-
5
-
6
-
7
-
8
-
9
-
10
-
11
-
12
-
13
-
14
-
15
-
16
-
17
-
18
-
19
-
20
-
21
-
22
-
23
-
24
-
25
-
26
-
27
-
28
-
29
-
30
-
31
-
32
-
33
-
34
-
35
-
36
-
37
-
38
-
39
-
40
-
41
-
42
-
43
-
44
-
45
-
46
-
47
-
48
-
49
-
50
-
51
-
52
-
53
-
54
-
55
-
56
-
57
-
58
-
59
-
60
-
61
-
62
-
63
-
64
-
65
-
66
-
67
-
68
-
69
-
70
-
71
-
72
-
73
-
74
-
75
-
76
-
77
-
78
-
79
-
80
-
81
-
82
-
83
-
84
-
85
-
86
-
87
-
88
-
89
-
90
-
91
-
92
-
93
-
94
-
95
-
96
-
97
-
98
-
 99
99 -
 100
100 -
 101
101 -
 102
102 -
 103
103 -
 104
104 -
 105
105 -
 106
106 -
 107
107 -
 108
108 -
 109
109 -
 110
110 -
 111
111 -
 112
112 -
 113
113 -
 114
114 -
 115
115 -
 116
116 -
 117
117 -
 118
118 -
 119
119 -
120
-
121
-
122
-
123
-
124
-
125
-
126
-
127
-
128
-
129
-
130
-
131
-
132
 |
 |

Google Inc.
NOTES TO CONSOLIDATED FINANCIAL STATEMENTS—(Continued)
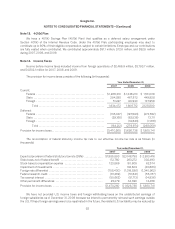
The total grant date fair value of stock options vested during 2007, 2008, and 2009 was $635.1 million,
$692.5 million, and $689.7 million. The aggregate intrinsic value of all options and warrants exercised during
2007, 2008 and 2009 was $1,279.0 million, $503.2 million, and $566.1 million. These amounts do not include the
aggregate sales price of options sold under our TSO program.
During 2009, the number of shares underlying TSOs sold to selected financial institutions under the TSO
program was approximately 1.1 million at a total value of $246.8 million, or an average of $231.36 per share,
including an average premium of $23.39 per share. The premium is calculated as the difference between (a) the
sale price of the TSO and (b) the intrinsic value of the TSO, which we define as the excess, if any, of the price of our
Class A common stock at the time of the sale over the exercise price of the TSO. At December 31 2009, the
number of options eligible for participation under the TSO program was approximately 10 million.
In March 2009, we completed an offer to exchange certain employee stock options issued under our 2004
Stock Plan. Certain previously granted options were exchanged for new options with a lower exercise price granted
on a one-for-one basis. Options for an aggregate of approximately 7.6 million shares of our Class A common stock
were exchanged. Options granted pursuant to the Exchange have an exercise price of $308.57 per share, the
closing price of our Class A common stock as reported by The Nasdaq Global Select Market on March 6, 2009.
Options granted pursuant to the Exchange have a new vesting schedule determined by adding 12 months to each
vesting date under the exchanged options’ original vesting schedule. In addition, new options will vest no sooner
than six months after the date of the Exchange. The Exchange resulted in a modification charge of approximately
$360 million which is being recognized over the vesting periods of the new options. These vesting periods range
from six months to five years. We recorded approximately $103 million of the modification charge in 2009.
As of December 31, 2009, there was $1,088.0 million of unrecognized compensation cost related to
outstanding employee stock options. This amount is expected to be recognized over a weighted-average period of
3.1 years. To the extent the actual forfeiture rate is different from what we have anticipated, stock-based
compensation related to these awards will be different from our expectations.
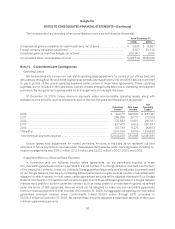
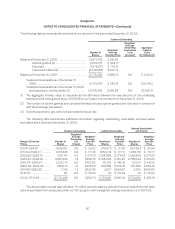
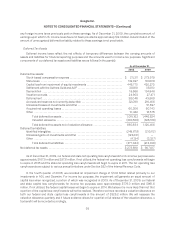
The following table summarizes the activities for our unvested RSUs and restricted shares for the year ended
December 31, 2009:
Unvested Restricted Stock Units
and Restricted Shares
Number of
Shares
Weighted-
Average
Grant-Date
Fair Value
Unvested at December 31, 2008 ............................................... 3,268,089 $ 514.56
Granted ................................................................ 2,991,909 $463.50
Vested ................................................................. (1,290,943) $ 491.13
Canceled ............................................................... (342,568) $464.62
Unvested at December 31, 2009 ............................................... 4,626,487 $492.42
Expected to vest after December 31, 2009 (1) ................................... 4,168,465 $492.42
(1) RSUs and restricted shares expected to vest reflect an estimated forfeiture rate.
As of December 31, 2009, there was $1,842.7 million of unrecognized compensation cost related to
employee unvested RSUs and restricted shares. This amount is expected to be recognized over a weighted-
average period of 3.0 years. To the extent the actual forfeiture rate is different from what we have anticipated,
stock-based compensation related to these awards will be different from our expectations.
91