Google 2009 Annual Report Download - page 70
Download and view the complete annual report
Please find page 70 of the 2009 Google annual report below. You can navigate through the pages in the report by either clicking on the pages listed below, or by using the keyword search tool below to find specific information within the annual report.-
 1
1 -
2
-
3
-
4
-
5
-
6
-
7
-
8
-
9
-
10
-
11
-
12
-
13
-
14
-
15
-
16
-
17
-
18
-
19
-
20
-
21
-
22
-
23
-
24
-
25
-
26
-
27
-
28
-
29
-
30
-
31
-
32
-
33
-
34
-
35
-
36
-
37
-
38
-
39
-
40
-
41
-
42
-
43
-
44
-
45
-
46
-
47
-
48
-
49
-
50
-
51
-
52
-
53
-
54
-
55
-
56
-
57
-
58
-
59
-
 60
60 -
 61
61 -
 62
62 -
 63
63 -
 64
64 -
 65
65 -
 66
66 -
 67
67 -
 68
68 -
 69
69 -
 70
70 -
 71
71 -
 72
72 -
 73
73 -
 74
74 -
 75
75 -
 76
76 -
 77
77 -
 78
78 -
 79
79 -
 80
80 -
81
-
82
-
83
-
84
-
85
-
86
-
87
-
88
-
89
-
90
-
91
-
92
-
93
-
94
-
95
-
96
-
97
-
98
-
99
-
100
-
101
-
102
-
103
-
104
-
105
-
106
-
107
-
108
-
109
-
110
-
111
-
112
-
113
-
114
-
115
-
116
-
117
-
118
-
119
-
120
-
121
-
122
-
123
-
124
-
125
-
126
-
127
-
128
-
129
-
130
-
131
-
132
 |
 |
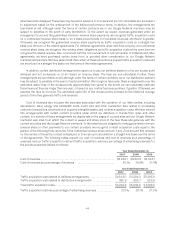
As we expand our business internationally, we have offered payment terms to certain advertisers that are
standard in their locales, but longer than terms we would generally offer to our domestic advertisers. This may
increase our working capital requirements and may have a negative effect on cash provided by our operating
activities. Also, as a result of our decision to review our business operations in China, we may incur exit costs
related to the potential shut down of Google.cn and our China offices.
Cash used in investing activities in 2009 of $8,019.2 million was primarily attributable to net purchases of
marketable securities of $7,036.2 million and capital expenditures of $809.9 million.
Cash used in investing activities in 2008 of $5,319.4 million was primarily attributable to cash consideration
used in acquisitions and other investments of $3,367.5 million primarily related to the acquisition of DoubleClick
and capital expenditures of $2,358.5 million, partially offset by net maturities and sales of marketable securities of
$406.5 million including our investment in Clearwire.
Cash used in investing activities in 2007 of $3,681.6 million was attributable to capital expenditures of
$2,402.8 million, cash consideration used in acquisitions and other investments of $941.2 million, primarily related
to the acquisition of Postini, and net purchases of marketable securities of $337.6 million.
Capital expenditures are mainly for the purchase of information technology assets. In order to manage
expected increases in internet traffic, advertising transactions, and new products and services, and to support our
overall global business expansion, we will make significant investments in data center operations, technology,
corporate facilities, and information technology infrastructure in 2010 and thereafter. However, the amount of our
capital expenditures has fluctuated and may continue to fluctuate on a quarterly basis.
In addition, we expect to spend a significant amount of cash on acquisitions and other investments from time
to time. In particular, we expect to increase the number of acquisitions we make in 2010 compared to 2009. These
acquisitions generally enhance the breadth and depth of our expertise in engineering and other functional areas,
our technologies and our product offerings. In connection with certain acquisitions, we are obligated to make
additional cash payments if certain criteria are met. As of December 31, 2009, the remaining contingent obligation
amount related to these acquisitions was approximately $35 million, which if the criteria are met, would be
recorded as part of the purchase. Since these contingent payments are based on the achievement of performance
targets, actual payments may be substantially lower.
Cash provided by financing activities in 2009 of $233.4 million was primarily due to net proceeds related to
stock-based award activities of $143.1 million. Net proceeds result when the cash we receive upon the exercise of
stock options exceeds the tax withholding payments we make on behalf of our employees upon the net settlement
of their vested restricted stock units. In addition, there were excess tax benefits of $90.3 million from stock-based
award activities during the period which represented a portion of the $260.2 million reduction to income taxes
payable that we recorded in 2009 related to the total direct tax benefit realized from the exercise, sale, or vesting
of these awards.
Cash provided by financing activities in 2008 of $87.6 million was due primarily to excess tax benefits of
$159.1 million from stock-based award activities during the period which represents a portion of the $250.9 million
reduction to income tax payable that we recorded in 2008 related to the total direct tax benefit realized from the
exercise, sale, or vesting of these awards, partially offset by net payments related to stock-based award activities
of $71.5 million.
Cash provided by financing activities in 2007 of $403.1 million was due primarily to excess tax benefits of
$379.2 million from stock-based award activities during the period and net proceeds related to stock-based award
activities of $23.9 million.
52