Google 2009 Annual Report Download - page 103
Download and view the complete annual report
Please find page 103 of the 2009 Google annual report below. You can navigate through the pages in the report by either clicking on the pages listed below, or by using the keyword search tool below to find specific information within the annual report.-
 1
1 -
2
-
3
-
4
-
5
-
6
-
7
-
8
-
9
-
10
-
11
-
12
-
13
-
14
-
15
-
16
-
17
-
18
-
19
-
20
-
21
-
22
-
23
-
24
-
25
-
26
-
27
-
28
-
29
-
30
-
31
-
32
-
33
-
34
-
35
-
36
-
37
-
38
-
39
-
40
-
41
-
42
-
43
-
44
-
45
-
46
-
47
-
48
-
49
-
50
-
51
-
52
-
53
-
54
-
55
-
56
-
57
-
58
-
59
-
60
-
61
-
62
-
63
-
64
-
65
-
66
-
67
-
68
-
69
-
70
-
71
-
72
-
73
-
74
-
75
-
76
-
77
-
78
-
79
-
80
-
81
-
82
-
83
-
84
-
85
-
86
-
87
-
88
-
89
-
90
-
91
-
92
-
 93
93 -
 94
94 -
 95
95 -
 96
96 -
 97
97 -
 98
98 -
 99
99 -
 100
100 -
 101
101 -
 102
102 -
 103
103 -
 104
104 -
 105
105 -
 106
106 -
 107
107 -
 108
108 -
 109
109 -
 110
110 -
 111
111 -
 112
112 -
 113
113 -
114
-
115
-
116
-
117
-
118
-
119
-
120
-
121
-
122
-
123
-
124
-
125
-
126
-
127
-
128
-
129
-
130
-
131
-
132
 |
 |

Google Inc.
NOTES TO CONSOLIDATED FINANCIAL STATEMENTS—(Continued)
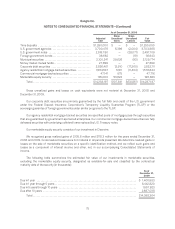
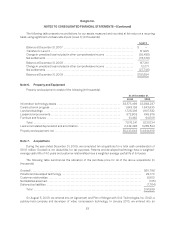
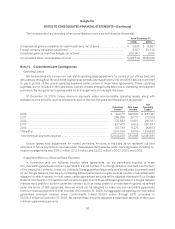
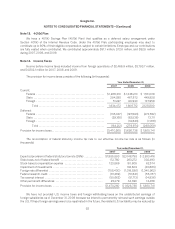
Patents and developed technology, customer relationships, and tradenames and other have weighted-
average useful lives from the date of purchase of 4.0 years, 6.4 years, and 4.6 years. Amortization expense of
acquisition-related intangible assets for the years ended December 31, 2007, 2008, and 2009 was $158.2 million,
$279.7 million, and $266.2 million. As of December 31, 2009, expected amortization expense for acquisition-
related intangible assets for each of the next five years and thereafter was as follows (in thousands):
2010 ...................................................................................... 230,077
2011 ...................................................................................... 182,395
2012 ...................................................................................... 140,695
2013 ...................................................................................... 108,967
2014 ...................................................................................... 101,402
Thereafter ................................................................................. 11,402
$774,938
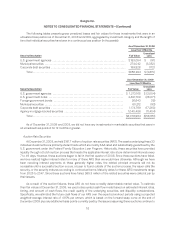
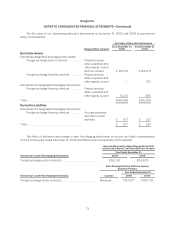
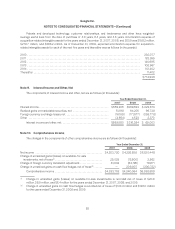
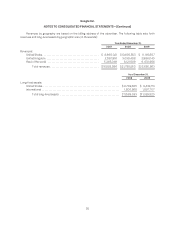
Note 9. Interest Income and Other, Net
The components of interest income and other, net are as follows (in thousands):
Year Ended December 31,
2007 2008 2009
Interest income ..................................................... $559,205 $389,533 $ 229,673
Realized gains on marketable securities, net ........................... 51,198 94,205 96,738
Foreign currency exchange losses, net ................................ (16,169) (171,877) (259,778)
Other ............................................................. (4,654) 4,523 2,370
Interest income and other, net ................................... $589,580 $ 316,384 $ 69,003
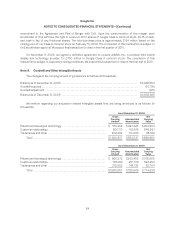
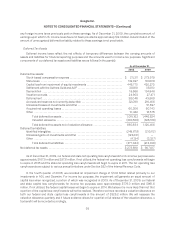
Note 10. Comprehensive Income
The changes in the components of other comprehensive income are as follows (in thousands):
Year Ended December 31,
2007 2008 2009
Net income ................................................... $4,203,720 $4,226,858 $6,520,448
Change in unrealized gains (losses) on available-for-sale
investments, net of taxes(1) .................................... 29,029 (12,506) 2,562
Change in foreign currency translation adjustment ................. 61,033 (84,195) 76,671
Change in unrealized gains on cash flow hedges, net of taxes(2) ...... — 209,907 (200,722)
Comprehensive income .................................... $4,293,782 $4,340,064 $6,398,959
(1) Change in unrealized gains (losses) on available-for-sale investments is recorded net of taxes of $20.0
million, $8.9 million, and $6.4 million for the years ended December 31, 2007, 2008, and 2009.
(2) Change in unrealized gains on cash flow hedges is recorded net of taxes of $144.4 million and $138.0 million
for the years ended December 31, 2008 and 2009.
85