Google 2009 Annual Report Download - page 61
Download and view the complete annual report
Please find page 61 of the 2009 Google annual report below. You can navigate through the pages in the report by either clicking on the pages listed below, or by using the keyword search tool below to find specific information within the annual report.-
 1
1 -
2
-
3
-
4
-
5
-
6
-
7
-
8
-
9
-
10
-
11
-
12
-
13
-
14
-
15
-
16
-
17
-
18
-
19
-
20
-
21
-
22
-
23
-
24
-
25
-
26
-
27
-
28
-
29
-
30
-
31
-
32
-
33
-
34
-
35
-
36
-
37
-
38
-
39
-
40
-
41
-
42
-
43
-
44
-
45
-
46
-
47
-
48
-
49
-
50
-
 51
51 -
 52
52 -
 53
53 -
 54
54 -
 55
55 -
 56
56 -
 57
57 -
 58
58 -
 59
59 -
 60
60 -
 61
61 -
 62
62 -
 63
63 -
 64
64 -
 65
65 -
 66
66 -
 67
67 -
 68
68 -
 69
69 -
 70
70 -
 71
71 -
72
-
73
-
74
-
75
-
76
-
77
-
78
-
79
-
80
-
81
-
82
-
83
-
84
-
85
-
86
-
87
-
88
-
89
-
90
-
91
-
92
-
93
-
94
-
95
-
96
-
97
-
98
-
99
-
100
-
101
-
102
-
103
-
104
-
105
-
106
-
107
-
108
-
109
-
110
-
111
-
112
-
113
-
114
-
115
-
116
-
117
-
118
-
119
-
120
-
121
-
122
-
123
-
124
-
125
-
126
-
127
-
128
-
129
-
130
-
131
-
132
 |
 |

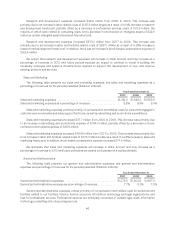
Revenues by Geography
Domestic and international revenues as a percentage of consolidated revenues, determined based on the
billing addresses of our advertisers, are set forth below.
Year Ended December 31,
2007 2008 2009
United States ................................................................... 52% 49% 47%
United Kingdom ................................................................. 15% 14% 13%
Rest of the world ................................................................ 33% 37% 40%
The growth in international revenues (other than the United Kingdom) as a percentage of consolidated
revenues from 2008 to 2009 resulted largely from increased acceptance of our advertising programs and our
continued progress in developing localized versions of our products for these international markets, partially offset
by the net effect of the general strengthening of the U.S. dollar compared to foreign currencies (primarily the Euro)
and the related hedging gains.
The decrease in revenues from the United Kingdom as a percentage of consolidated revenues from 2008 to
2009 resulted largely from the effect of the general strengthening of the U.S. dollar compared to the British
pound, partially offset by more hedging gains realized from our foreign exchange risk management program in
2009 as compared to 2008.
The general strengthening of the U.S. dollar relative to foreign currencies (primarily the British pound and the
Euro) from 2008 to 2009 had an unfavorable impact on our international revenues (international revenues
increased $1,297.0 million during this period). Had foreign exchange rates remained constant in these periods, our
total revenues would have been approximately $1.03 billion, or 4.3%, higher in 2009. This is before consideration
of hedging gains recognized to revenues of $167.8 million and $324.7 million in 2008 and 2009.
The growth in international revenues from 2007 to 2008 resulted largely from increased acceptance of our
advertising programs and increases in our direct sales resources and customer support operations in international
markets, our continued progress in developing localized versions of our products for these international markets,
the favorable effect of the general weakening of the U.S. dollar compared to foreign currencies (primarily the Euro
and the Japanese yen) as well as hedging gains realized in 2008 from our foreign exchange risk management
program. We recognized no such gains in 2007.
Although we expect to continue to invest in international markets, these investments may not result in an
increase in our international revenues as a percentage of total revenues in 2010 or thereafter. See Note 15 of
Notes to Consolidated Financial Statements included in Item 8 of this Annual Report on Form 10-K for additional
information about geographic areas.
Costs and Expenses
Cost of Revenues
Cost of revenues consists primarily of traffic acquisition costs. Traffic acquisition costs consist of amounts
ultimately paid to our Google Network members under AdSense arrangements and to certain other partners (our
distribution partners) who distribute our toolbar and other products (collectively referred to as access points) or
otherwise direct search queries to our web site (collectively referred to as distribution arrangements). These
amounts are primarily based on the revenue share arrangements with our Google Network members and
distribution partners.
Certain AdSense agreements obligate us to make guaranteed minimum revenue share payments to Google
Network members based on their achieving defined performance terms, such as number of search queries or
43