Google 2009 Annual Report Download - page 53
Download and view the complete annual report
Please find page 53 of the 2009 Google annual report below. You can navigate through the pages in the report by either clicking on the pages listed below, or by using the keyword search tool below to find specific information within the annual report.-
 1
1 -
2
-
3
-
4
-
5
-
6
-
7
-
8
-
9
-
10
-
11
-
12
-
13
-
14
-
15
-
16
-
17
-
18
-
19
-
20
-
21
-
22
-
23
-
24
-
25
-
26
-
27
-
28
-
29
-
30
-
31
-
32
-
33
-
34
-
35
-
36
-
37
-
38
-
39
-
40
-
41
-
42
-
 43
43 -
 44
44 -
 45
45 -
 46
46 -
 47
47 -
 48
48 -
 49
49 -
 50
50 -
 51
51 -
 52
52 -
 53
53 -
 54
54 -
 55
55 -
 56
56 -
 57
57 -
 58
58 -
 59
59 -
 60
60 -
 61
61 -
 62
62 -
 63
63 -
64
-
65
-
66
-
67
-
68
-
69
-
70
-
71
-
72
-
73
-
74
-
75
-
76
-
77
-
78
-
79
-
80
-
81
-
82
-
83
-
84
-
85
-
86
-
87
-
88
-
89
-
90
-
91
-
92
-
93
-
94
-
95
-
96
-
97
-
98
-
99
-
100
-
101
-
102
-
103
-
104
-
105
-
106
-
107
-
108
-
109
-
110
-
111
-
112
-
113
-
114
-
115
-
116
-
117
-
118
-
119
-
120
-
121
-
122
-
123
-
124
-
125
-
126
-
127
-
128
-
129
-
130
-
131
-
132
 |
 |

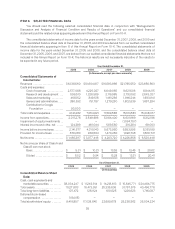
ITEM 6. SELECTED FINANCIAL DATA
You should read the following selected consolidated financial data in conjunction with “Management’s
Discussion and Analysis of Financial Condition and Results of Operations” and our consolidated financial
statements and the related notes appearing elsewhere in this Annual Report on Form 10-K.
The consolidated statements of income data for the years ended December 31, 2007, 2008, and 2009 and
the consolidated balance sheet data at December 31, 2008, and 2009 are derived from our audited consolidated
financial statements appearing in Item 8 of this Annual Report on Form 10-K. The consolidated statements of
income data for the years ended December 31, 2005 and 2006, and the consolidated balance sheet data at
December 31, 2005, 2006, and 2007, are derived from our audited consolidated financial statements that are not
included in this Annual Report on Form 10-K. The historical results are not necessarily indicative of the results to
be expected in any future period.
Year Ended December 31,
2005 2006 2007 2008 2009
(in thousands, except per share amounts)
Consolidated Statements of
Income Data:
Revenues ....................... $6,138,560 $10,604,917 $16,593,986 $21,795,550 $23,650,563
Costs and expenses:
Cost of revenues ............ 2,577,088 4,225,027 6,649,085 8,621,506 8,844,115
Research and development . . . 599,510 1,228,589 2,119,985 2,793,192 2,843,027
Sales and marketing ......... 468,152 849,518 1,461,266 1,946,244 1,983,941
General and administrative .... 386,532 751,787 1,279,250 1,802,639 1,667,294
Contribution to Google
Foundation ............... 90,000 — — — —
Total costs and expenses .......... 4,121,282 7,054,921 11,509,586 15,163,581 15,338,377
Income from operations ........... 2,017,278 3,549,996 5,084,400 6,631,969 8,312,186
Impairment of equity investments . . — — — (1,094,757) —
Interest income and other, net ..... 124,399 461,044 589,580 316,384 69,003
Income before income taxes ....... 2,141,677 4,011,040 5,673,980 5,853,596 8,381,189
Provision for income taxes ........ 676,280 933,594 1,470,260 1,626,738 1,860,741
Net income ...................... $1,465,397 $ 3,077,446 $ 4,203,720 $ 4,226,858 $ 6,520,448
Net income per share of Class A and
Class B common stock
Basic ....................... $ 5.31 $ 10.21 $ 13.53 $ 13.46 $ 20.62
Diluted ..................... $ 5.02 $ 9.94 $ 13.29 $ 13.31 $ 20.41
As of December 31,
2005 2006 2007 2008 2009
(in thousands)
Consolidated Balance Sheet
Data:
Cash, cash equivalents and
marketable securities ......... $8,034,247 $ 11,243,914 $ 14,218,613 $ 15,845,771 $ 24,484,775
Total assets .................... 10,271,813 18,473,351 25,335,806 31,767,575 40,496,778
Total long-term liabilities ........ 107,472 128,924 610,525 1,226,623 1,745,087
Deferred stock-based
compensation ............... (119,015) — — — —
Total stockholders’ equity ....... 9,418,957 17,039,840 22,689,679 28,238,862 36,004,224
35