Google 2009 Annual Report Download - page 82
Download and view the complete annual report
Please find page 82 of the 2009 Google annual report below. You can navigate through the pages in the report by either clicking on the pages listed below, or by using the keyword search tool below to find specific information within the annual report.-
 1
1 -
2
-
3
-
4
-
5
-
6
-
7
-
8
-
9
-
10
-
11
-
12
-
13
-
14
-
15
-
16
-
17
-
18
-
19
-
20
-
21
-
22
-
23
-
24
-
25
-
26
-
27
-
28
-
29
-
30
-
31
-
32
-
33
-
34
-
35
-
36
-
37
-
38
-
39
-
40
-
41
-
42
-
43
-
44
-
45
-
46
-
47
-
48
-
49
-
50
-
51
-
52
-
53
-
54
-
55
-
56
-
57
-
58
-
59
-
60
-
61
-
62
-
63
-
64
-
65
-
66
-
67
-
68
-
69
-
70
-
71
-
 72
72 -
 73
73 -
 74
74 -
 75
75 -
 76
76 -
 77
77 -
 78
78 -
 79
79 -
 80
80 -
 81
81 -
 82
82 -
 83
83 -
 84
84 -
 85
85 -
 86
86 -
 87
87 -
 88
88 -
 89
89 -
 90
90 -
 91
91 -
 92
92 -
93
-
94
-
95
-
96
-
97
-
98
-
99
-
100
-
101
-
102
-
103
-
104
-
105
-
106
-
107
-
108
-
109
-
110
-
111
-
112
-
113
-
114
-
115
-
116
-
117
-
118
-
119
-
120
-
121
-
122
-
123
-
124
-
125
-
126
-
127
-
128
-
129
-
130
-
131
-
132
 |
 |

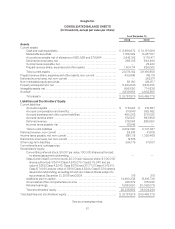
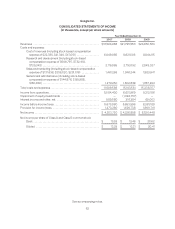
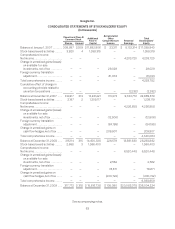
Google Inc.
CONSOLIDATED STATEMENTS OF CASH FLOWS
(In thousands)
Year Ended December 31,
2007 2008 2009
Operating activities
Net income ............................................... $ 4,203,720 $ 4,226,858 $ 6,520,448
Adjustments:
Depreciation and amortization of property and
equipment ......................................... 807,743 1,212,237 1,240,030
Amortization of intangible and other assets .............. 159,915 287,650 284,278
Stock-based compensation expense .................... 868,646 1,119,766 1,164,054
Excess tax benefits from stock-based award activities ..... (379,206) (159,088) (90,271)
Deferred income taxes ................................. (164,212) (224,645) (268,060)
Impairment of equity investments ....................... — 1,094,757 —
Other ................................................ (39,741) (31,910) (20,268)
Changes in assets and liabilities, net of effects of
acquisitions and divestiture:
Accounts receivable .............................. (837,247) (334,464) (504,039)
Income taxes, net ................................. 744,802 626,027 217,476
Prepaid revenue share, expenses and other assets .... (298,689) (147,132) 262,035
Accounts payable ................................ 70,135 (211,539) 33,642
Accrued expenses and other liabilities ............... 418,905 338,907 243,138
Accrued revenue share ............................ 150,310 14,000 157,669
Deferred revenue ................................. 70,329 41,433 76,066
Net cash provided by operating activities ..................... 5,775,410 7,852,857 9,316,198
Investing activities
Purchases of property and equipment ........................ (2,402,840) (2,358,461) (809,888)
Purchases of marketable securities .......................... (15,997,060) (15,356,304) (29,139,065)
Maturities and sales of marketable securities .................. 15,659,473 15,762,796 22,102,867
Investments in non-marketable equity securities .............. (34,511) (47,154) (65,095)
Acquisitions, net of cash acquired and proceeds received from
divestiture, and purchases of intangible and other assets ..... (906,651) (3,320,299) (108,024)
Net cash used in investing activities ......................... (3,681,589) (5,319,422) (8,019,205)
Financing activities
Net proceeds (payments) from stock-based award activities .... 23,861 (71,521) 143,141
Excess tax benefits from stock-based award activities ......... 379,206 159,088 90,271
Net cash provided by financing activities ..................... 403,067 87,567 233,412
Effect of exchange rate changes on cash and cash
equivalents ............................................. 40,034 (45,923) 10,511
Net increase in cash and cash equivalents .................... 2,536,922 2,575,079 1,540,916
Cash and cash equivalents at beginning of year ............... 3,544,671 6,081,593 8,656,672
Cash and cash equivalents at end of year ..................... $ 6,081,593 $ 8,656,672 $ 10,197,588
Supplemental disclosures of cash flow information
Cash paid for taxes ........................................ $ 882,688 $ 1,223,985 $ 1,895,966
See accompanying notes.
64