Google 2009 Annual Report Download - page 52
Download and view the complete annual report
Please find page 52 of the 2009 Google annual report below. You can navigate through the pages in the report by either clicking on the pages listed below, or by using the keyword search tool below to find specific information within the annual report.-
 1
1 -
2
-
3
-
4
-
5
-
6
-
7
-
8
-
9
-
10
-
11
-
12
-
13
-
14
-
15
-
16
-
17
-
18
-
19
-
20
-
21
-
22
-
23
-
24
-
25
-
26
-
27
-
28
-
29
-
30
-
31
-
32
-
33
-
34
-
35
-
36
-
37
-
38
-
39
-
40
-
41
-
 42
42 -
 43
43 -
 44
44 -
 45
45 -
 46
46 -
 47
47 -
 48
48 -
 49
49 -
 50
50 -
 51
51 -
 52
52 -
 53
53 -
 54
54 -
 55
55 -
 56
56 -
 57
57 -
 58
58 -
 59
59 -
 60
60 -
 61
61 -
 62
62 -
63
-
64
-
65
-
66
-
67
-
68
-
69
-
70
-
71
-
72
-
73
-
74
-
75
-
76
-
77
-
78
-
79
-
80
-
81
-
82
-
83
-
84
-
85
-
86
-
87
-
88
-
89
-
90
-
91
-
92
-
93
-
94
-
95
-
96
-
97
-
98
-
99
-
100
-
101
-
102
-
103
-
104
-
105
-
106
-
107
-
108
-
109
-
110
-
111
-
112
-
113
-
114
-
115
-
116
-
117
-
118
-
119
-
120
-
121
-
122
-
123
-
124
-
125
-
126
-
127
-
128
-
129
-
130
-
131
-
132
 |
 |

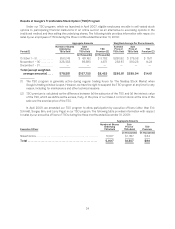
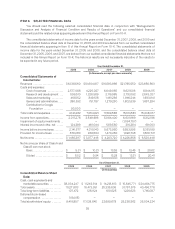
Results of Google’s Transferable Stock Option (TSO) Program
Under our TSO program, which we launched in April 2007, eligible employees are able to sell vested stock
options to participating financial institutions in an online auction as an alternative to exercising options in the
traditional method and then selling the underlying shares. The following table provides information with respect to
sales by our employees of TSOs during the three months ended December 31, 2009:
Aggregate Amounts Weighted-Average Per Share Amounts
Period (1)
Number of Shares
Underlying
TSOs Sold
Sale
Price of
TSOs Sold TSO
Premium (2)
Exercise
Price of
TSOs Sold
Sale
Price of
TSOs Sold TSO
Premium (2)
(in thousands) (in thousands)
October 1 – 31 ............ 250,243 $ 69,162 $ 3,782 $290.92 $ 276.38 $ 15.11
November 1 – 30 ......... 328,338 98,593 4,671 283.67 300.28 14.23
December 1 – 31 .......... — — — — — —
Total (except weighted-
average amounts) .... 578,581 $167,755 $8,453 $286.81 $289.94 $14.61
(1) The TSO program is generally active during regular trading hours for The Nasdaq Stock Market when
Google’s trading window is open. However, we have the right to suspend the TSO program at any time for any
reason, including for maintenance and other technical reasons.
(2) TSO premium is calculated as the difference between (a) the sale price of the TSO and (b) the intrinsic value
of the TSO, which we define as the excess, if any, of the price of our Class A common stock at the time of the
sale over the exercise price of the TSO.
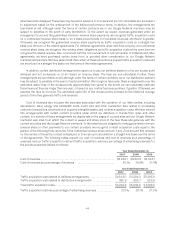
In April 2009, we amended our TSO program to allow participation by executive officers (other than Eric
Schmidt, Sergey Brin, and Larry Page) in our TSO program. The following table provides information with respect
to sales by our executive officers of TSOs during the three months ended December 31, 2009:
Aggregate Amounts
Executive Officer
Number of Shares
Underlying
TSOs Sold
Sale
Price of
TSOs Sold TSO
Premium
(in thousands) (in thousands)
Nikesh Arora ............................................... 5,007 $ 1,357 $84
Total .................................................. 5,007 $1,357 $84
34