Google 2009 Annual Report Download - page 79
Download and view the complete annual report
Please find page 79 of the 2009 Google annual report below. You can navigate through the pages in the report by either clicking on the pages listed below, or by using the keyword search tool below to find specific information within the annual report.-
 1
1 -
2
-
3
-
4
-
5
-
6
-
7
-
8
-
9
-
10
-
11
-
12
-
13
-
14
-
15
-
16
-
17
-
18
-
19
-
20
-
21
-
22
-
23
-
24
-
25
-
26
-
27
-
28
-
29
-
30
-
31
-
32
-
33
-
34
-
35
-
36
-
37
-
38
-
39
-
40
-
41
-
42
-
43
-
44
-
45
-
46
-
47
-
48
-
49
-
50
-
51
-
52
-
53
-
54
-
55
-
56
-
57
-
58
-
59
-
60
-
61
-
62
-
63
-
64
-
65
-
66
-
67
-
68
-
 69
69 -
 70
70 -
 71
71 -
 72
72 -
 73
73 -
 74
74 -
 75
75 -
 76
76 -
 77
77 -
 78
78 -
 79
79 -
 80
80 -
 81
81 -
 82
82 -
 83
83 -
 84
84 -
 85
85 -
 86
86 -
 87
87 -
 88
88 -
 89
89 -
90
-
91
-
92
-
93
-
94
-
95
-
96
-
97
-
98
-
99
-
100
-
101
-
102
-
103
-
104
-
105
-
106
-
107
-
108
-
109
-
110
-
111
-
112
-
113
-
114
-
115
-
116
-
117
-
118
-
119
-
120
-
121
-
122
-
123
-
124
-
125
-
126
-
127
-
128
-
129
-
130
-
131
-
132
 |
 |

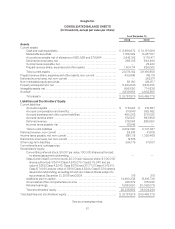
Google Inc.
CONSOLIDATED BALANCE SHEETS
(In thousands, except par value per share)
As of December 31,
2008 2009
Assets
Current assets:
Cash and cash equivalents ............................................ $ 8,656,672 $ 10,197,588
Marketable securities ................................................. 7,189,099 14,287,187
Accounts receivable, net of allowance of $80,086 and $78,884 ........... 2,642,192 3,178,471
Deferred income taxes, net ............................................ 286,105 644,406
Income taxes receivable, net ........................................... — 23,244
Prepaid revenue share, expenses and other assets ....................... 1,404,114 836,062
Total current assets .................................................. 20,178,182 29,166,958
Prepaid revenue share, expenses and other assets, non-current ................ 433,846 416,119
Deferred income taxes, net, non-current ..................................... — 262,611
Non-marketable equity securities ........................................... 85,160 128,977
Property and equipment, net ............................................... 5,233,843 4,844,610
Intangible assets, net ...................................................... 996,690 774,938
Goodwill ................................................................. 4,839,854 4,902,565
Total assets ......................................................... $ 31,767,575 $40,496,778
Liabilities and Stockholders’ Equity
Current liabilities:
Accounts payable .................................................... $ 178,004 $ 215,867
Accrued compensation and benefits .................................... 811,643 982,482
Accrued expenses and other current liabilities ........................... 480,263 570,080
Accrued revenue share ............................................... 532,547 693,958
Deferred revenue ..................................................... 218,084 285,080
Incomes taxes payable, net ............................................ 81,549 —
Total current liabilities ................................................ 2,302,090 2,747,467
Deferred revenue, non-current ............................................. 29,818 41,618
Income taxes payable, net, non-current ...................................... 890,115 1,392,468
Deferred income taxes, net, non-current ..................................... 12,515 —
Other long-term liabilities .................................................. 294,175 311,001
Commitments and contingencies
Stockholders’ equity:
Convertible preferred stock, $0.001 par value, 100,000 shares authorized;
no shares issued and outstanding .................................... — —
Class A and Class B common stock, $0.001 par value per share: 9,000,000
shares authorized; 315,114 (Class A 240,073, Class B 75,041) and par
value of $315 (Class A $240, Class B $75) and 317,772 (Class A 243,611,
Class B 74,161) and par value of $318 (Class A $244, Class B $74) shares
issued and outstanding, excluding 26 and zero Class A shares subject to
repurchase at December 31, 2008 and 2009 ......................... 315 318
Additional paid-in capital .............................................. 14,450,338 15,816,738
Accumulated other comprehensive income ............................. 226,579 105,090
Retained earnings .................................................... 13,561,630 20,082,078
Total stockholders’ equity ............................................. 28,238,862 36,004,224
Total liabilities and stockholders’ equity ...................................... $ 31,767,575 $40,496,778
See accompanying notes.
61