Google 2007 Annual Report Download - page 95
Download and view the complete annual report
Please find page 95 of the 2007 Google annual report below. You can navigate through the pages in the report by either clicking on the pages listed below, or by using the keyword search tool below to find specific information within the annual report.-
 1
1 -
2
-
3
-
4
-
5
-
6
-
7
-
8
-
9
-
10
-
11
-
12
-
13
-
14
-
15
-
16
-
17
-
18
-
19
-
20
-
21
-
22
-
23
-
24
-
25
-
26
-
27
-
28
-
29
-
30
-
31
-
32
-
33
-
34
-
35
-
36
-
37
-
38
-
39
-
40
-
41
-
42
-
43
-
44
-
45
-
46
-
47
-
48
-
49
-
50
-
51
-
52
-
53
-
54
-
55
-
56
-
57
-
58
-
59
-
60
-
61
-
62
-
63
-
64
-
65
-
66
-
67
-
68
-
69
-
70
-
71
-
72
-
73
-
74
-
75
-
76
-
77
-
78
-
79
-
80
-
81
-
82
-
83
-
84
-
 85
85 -
 86
86 -
 87
87 -
 88
88 -
 89
89 -
 90
90 -
 91
91 -
 92
92 -
 93
93 -
 94
94 -
 95
95 -
 96
96 -
 97
97 -
 98
98 -
 99
99 -
 100
100 -
 101
101 -
 102
102 -
 103
103 -
 104
104 -
 105
105 -
106
-
107
-
108
-
109
-
110
-
111
-
112
-
113
-
114
-
115
-
116
-
117
-
118
-
119
-
120
-
121
-
122
-
123
-
124
 |
 |

Google Inc.
NOTES TO CONSOLIDATED FINANCIAL STATEMENTS—(Continued)
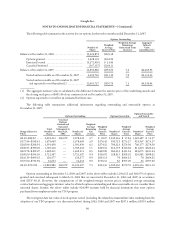
Gross unrealized gains and losses on cash equivalents were not material at December 31, 2006 and 2007. We did not
experience any significant realized gains or losses on our investments in 2005. We recognized a net realized gain of $40.2
million on the sale of marketable securities in 2006 primarily as a result of realized gain of $54.9 million on the sale of one
of our equity investments. In 2007, we recognized gross realized gains and losses of $81.7 million and $30.5 million on our
marketable securities. There were no other-than-temporary impairments to our marketable securities in 2005, 2006 and
2007. Realized gains and losses are included in interest income and other, net in our accompanying Consolidated
Statements of Income.
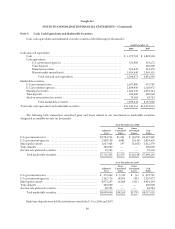
The following table summarizes the estimated fair value of our investments in marketable debt securities designated
as available-for-sale classified by the contractual maturity date of the security (in thousands):
As of
December 31,
2007
Due within 1 year ......................................................................... $1,964,325
Due within 1 year through 5 years ............................................................ 3,359,472
Due within 5 years through 10 years .......................................................... 310,332
Due after 10 years ......................................................................... 2,454,188
Total marketable debt securities ......................................................... $8,088,317
In accordance with EITF 03-1, The Meaning of Other-Than-Temporary Impairment and Its Application to Certain
Investments, the following table shows gross unrealized losses and fair value for those investments that were in an
unrealized loss position as of December 31, 2006 and 2007, aggregated by investment category and the length of time that
individual securities have been in a continuous loss position (in thousands):
As of December 31, 2006
Less than 12 Months 12 Months or Greater Total
Security Description Fair Value Unrealized
Loss Fair Value Unrealized
Loss Fair Value Unrealized
Loss
U.S. government notes ................ $ 893,264 $(3,339) $1,138,237 $(4,735) $2,031,501 $ (8,074)
U.S. government agencies .............. 1,620,106 (2,603) 193,178 (807) 1,813,284 (3,410)
Municipal securities ................... 676,089 (1,473) 248,953 (3,582) 925,042 (5,055)
Total .......................... $3,189,459 $(7,415) $1,580,368 $(9,124) $4,769,827 $(16,539)
As of December 31, 2007
Less than 12 Months 12 Months or Greater Total
Security Description Fair Value Unrealized
Loss Fair Value Unrealized
Loss Fair Value Unrealized
Loss
U.S. government notes ................ $ 30,525 $ (4) $ — $ — $ 30,525 $ (4)
U.S. government agencies .............. 98,682 (41) 19,993 (3) 118,675 (44)
Municipal securities ................... 270,708 (227) 54,832 (104) 325,540 (331)
Total .......................... $ 399,915 $ (272) $ 74,825 $ (107) $ 474,740 $ (379)
81