Google 2007 Annual Report Download - page 94
Download and view the complete annual report
Please find page 94 of the 2007 Google annual report below. You can navigate through the pages in the report by either clicking on the pages listed below, or by using the keyword search tool below to find specific information within the annual report.-
 1
1 -
2
-
3
-
4
-
5
-
6
-
7
-
8
-
9
-
10
-
11
-
12
-
13
-
14
-
15
-
16
-
17
-
18
-
19
-
20
-
21
-
22
-
23
-
24
-
25
-
26
-
27
-
28
-
29
-
30
-
31
-
32
-
33
-
34
-
35
-
36
-
37
-
38
-
39
-
40
-
41
-
42
-
43
-
44
-
45
-
46
-
47
-
48
-
49
-
50
-
51
-
52
-
53
-
54
-
55
-
56
-
57
-
58
-
59
-
60
-
61
-
62
-
63
-
64
-
65
-
66
-
67
-
68
-
69
-
70
-
71
-
72
-
73
-
74
-
75
-
76
-
77
-
78
-
79
-
80
-
81
-
82
-
83
-
 84
84 -
 85
85 -
 86
86 -
 87
87 -
 88
88 -
 89
89 -
 90
90 -
 91
91 -
 92
92 -
 93
93 -
 94
94 -
 95
95 -
 96
96 -
 97
97 -
 98
98 -
 99
99 -
 100
100 -
 101
101 -
 102
102 -
 103
103 -
 104
104 -
105
-
106
-
107
-
108
-
109
-
110
-
111
-
112
-
113
-
114
-
115
-
116
-
117
-
118
-
119
-
120
-
121
-
122
-
123
-
124
 |
 |

Google Inc.
NOTES TO CONSOLIDATED FINANCIAL STATEMENTS—(Continued)
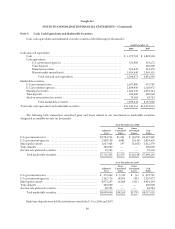
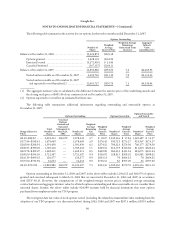
Note 3. Cash, Cash Equivalents and Marketable Securities
Cash, cash equivalents and marketable securities consists of the following (in thousands):
As of December 31,
2006 2007
Cash and cash equivalents:
Cash .................................................................. $ 1,579,702 $ 2,869,528
Cash equivalents:
U.S. government agencies ............................................. 323,900 110,272
Time deposits ...................................................... — 500,000
Municipal securities ................................................. 216,529 232,278
Money market mutual funds ........................................... 1,424,540 2,369,515
Total cash and cash equivalents .................................... 3,544,671 6,081,593
Marketable securities:
U.S. government notes ................................................... 2,697,880 475,781
U.S. government agencies ................................................. 2,839,430 2,120,972
Municipal securities ...................................................... 1,622,570 4,991,564
Time deposits ........................................................... 500,000 500,000
Auction rate preferred securities ............................................ 39,363 48,703
Total marketable securities ....................................... 7,699,243 8,137,020
Total cash, cash equivalents and marketable securities ............................... $11,243,914 $14,218,613
The following table summarizes unrealized gains and losses related to our investments in marketable securities
designated as available-for-sale (in thousands):
As of December 31, 2006
Adjusted
Cost
Gross
Unrealized
Gains
Gross
Unrealized
Losses Fair
Value
U.S. government notes ...................................... $2,704,753 $1,201 $ (8,074) $2,697,880
U.S. government agencies ................................... 2,838,759 4,081 (3,410) 2,839,430
Municipal securities ........................................ 1,627,428 197 (5,055) 1,622,570
Time deposits ............................................. 500,000 — — 500,000
Auction rate preferred securities .............................. 39,363 — — 39,363
Total marketable securities .............................. $7,710,303 $5,479 $(16,539) $7,699,243
As of December 31, 2007
Adjusted
Cost
Gross
Unrealized
Gains
Gross
Unrealized
Losses Fair
Value
U.S. government notes ...................................... $ 472,040 $ 3,745 $ (4) $ 475,781
U.S. government agencies ................................... 2,102,710 18,306 (44) 2,120,972
Municipal securities ........................................ 4,975,587 16,308 (331) 4,991,564
Time deposits ............................................. 500,000 — — 500,000
Auction rate preferred securities .............................. 48,703 — — 48,703
Total marketable securities .............................. $8,099,040 $38,359 $(379) $8,137,020
Bank time deposits were held by institutions outside the U.S. in 2006 and 2007.
80