Google 2007 Annual Report Download - page 57
Download and view the complete annual report
Please find page 57 of the 2007 Google annual report below. You can navigate through the pages in the report by either clicking on the pages listed below, or by using the keyword search tool below to find specific information within the annual report.-
 1
1 -
2
-
3
-
4
-
5
-
6
-
7
-
8
-
9
-
10
-
11
-
12
-
13
-
14
-
15
-
16
-
17
-
18
-
19
-
20
-
21
-
22
-
23
-
24
-
25
-
26
-
27
-
28
-
29
-
30
-
31
-
32
-
33
-
34
-
35
-
36
-
37
-
38
-
39
-
40
-
41
-
42
-
43
-
44
-
45
-
46
-
 47
47 -
 48
48 -
 49
49 -
 50
50 -
 51
51 -
 52
52 -
 53
53 -
 54
54 -
 55
55 -
 56
56 -
 57
57 -
 58
58 -
 59
59 -
 60
60 -
 61
61 -
 62
62 -
 63
63 -
 64
64 -
 65
65 -
 66
66 -
 67
67 -
68
-
69
-
70
-
71
-
72
-
73
-
74
-
75
-
76
-
77
-
78
-
79
-
80
-
81
-
82
-
83
-
84
-
85
-
86
-
87
-
88
-
89
-
90
-
91
-
92
-
93
-
94
-
95
-
96
-
97
-
98
-
99
-
100
-
101
-
102
-
103
-
104
-
105
-
106
-
107
-
108
-
109
-
110
-
111
-
112
-
113
-
114
-
115
-
116
-
117
-
118
-
119
-
120
-
121
-
122
-
123
-
124
 |
 |

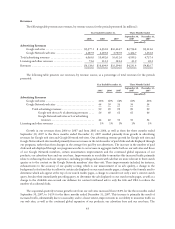
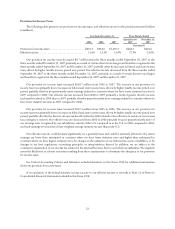
Revenues
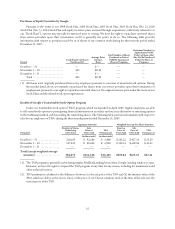
The following table presents our revenues, by revenue source, for the periods presented (in millions):
Year Ended December 31, Three Months Ended
2005 2006 2007 September 30,
2007 December 31,
2007
(unaudited)
Advertising Revenues
Google web sites ........................... $3,377.1 $ 6,332.8 $10,624.7 $2,734.8 $3,121.6
Google Network web sites ................... 2,687.9 4,159.8 5,787.9 1,454.7 1,635.8
Total advertising revenues ....................... 6,065.0 10,492.6 16,412.6 4,189.5 4,757.4
Licensing and other revenues ..................... 73.6 112.3 181.4 41.9 69.3
Revenues ..................................... $6,138.6 $10,604.9 $16,594.0 $4,231.4 $4,826.7
The following table presents our revenues, by revenue source, as a percentage of total revenues for the periods
presented:
Year Ended December 31, Three Months Ended
2005 2006 2007 September 30,
2007 December 31,
2007
(unaudited)
Advertising Revenues
Google web sites .................................... 55% 60% 64% 65% 65%
Google Network web sites ............................ 44 39 35 34 34
Total advertising revenues ........................ 99 99 99 99 99
Google web sites as % of advertising revenues .... 56 60 65 65 66
Google Network web sites as % of advertising
revenues ................................ 44 40 35 35 34
Licensing and other revenues .............................. 1% 1% 1% 1% 1%
Growth in our revenues from 2006 to 2007 and from 2005 to 2006, as well as from the three months ended
September 30, 2007 to the three months ended December 31, 2007 resulted primarily from growth in advertising
revenues for Google web sites and Google Network web sites. Our advertising revenue growth for Google web sites and
Google Network web sites resulted primarily from an increase in the total number of paid clicks and ads displayed through
our programs, rather than from changes in the average fees paid by our advertisers. The increase in the number of paid
clicks and ads displayed through our programs was due to an increase in aggregate traffic both on our web sites and those
of our Google Network members, certain monetization improvements and the continued global expansion of our
products, our advertiser base and our user base. Improvements in our ability to monetize this increased traffic primarily
relate to enhancing the end user experience, including providing end users with ads that are more relevant to their search
queries or to the content on the Google Network members’ sites they visit. These improvements included, for instance,
enhancements to the accuracy of our quality scoring, which is our measurement of an ad’s quality, a change in the
background color from blue to yellow for certain ads displayed on our search results pages, a change to the formula used to
determine which ads appear at the top of our search results pages, a change to consider not only a user’s current search
query, but also their immediately preceding query, to determine the ads displayed on our search results pages, as well as a
change to the clickable area around our AdSense for content text-based ads to only the title and URL to reduce the
number of accidental clicks.
The sequential quarterly revenue growth rate from our web sites increased from 10.0% for the three months ended
September 30, 2007, to 14.1% for the three months ended December 31, 2007. This increase is primarily the result of
increased traffic, substantially due to seasonality, and to a lesser extent, improvements in our ability to monetize traffic on
our web sites, as well as the continued global expansion of our products, our advertiser base and our user base. The
43