Google 2007 Annual Report Download - page 82
Download and view the complete annual report
Please find page 82 of the 2007 Google annual report below. You can navigate through the pages in the report by either clicking on the pages listed below, or by using the keyword search tool below to find specific information within the annual report.-
 1
1 -
2
-
3
-
4
-
5
-
6
-
7
-
8
-
9
-
10
-
11
-
12
-
13
-
14
-
15
-
16
-
17
-
18
-
19
-
20
-
21
-
22
-
23
-
24
-
25
-
26
-
27
-
28
-
29
-
30
-
31
-
32
-
33
-
34
-
35
-
36
-
37
-
38
-
39
-
40
-
41
-
42
-
43
-
44
-
45
-
46
-
47
-
48
-
49
-
50
-
51
-
52
-
53
-
54
-
55
-
56
-
57
-
58
-
59
-
60
-
61
-
62
-
63
-
64
-
65
-
66
-
67
-
68
-
69
-
70
-
71
-
 72
72 -
 73
73 -
 74
74 -
 75
75 -
 76
76 -
 77
77 -
 78
78 -
 79
79 -
 80
80 -
 81
81 -
 82
82 -
 83
83 -
 84
84 -
 85
85 -
 86
86 -
 87
87 -
 88
88 -
 89
89 -
 90
90 -
 91
91 -
 92
92 -
93
-
94
-
95
-
96
-
97
-
98
-
99
-
100
-
101
-
102
-
103
-
104
-
105
-
106
-
107
-
108
-
109
-
110
-
111
-
112
-
113
-
114
-
115
-
116
-
117
-
118
-
119
-
120
-
121
-
122
-
123
-
124
 |
 |

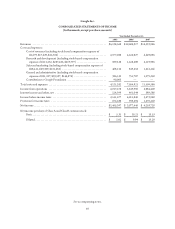
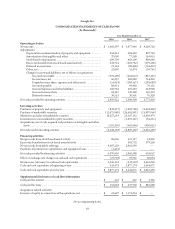
Google Inc.
CONSOLIDATED STATEMENTS OF CASH FLOWS
(In thousands)
Year Ended December 31,
2005 2006 2007
Operating activities
Net income .................................................. $ 1,465,397 $ 3,077,446 $ 4,203,720
Adjustments:
Depreciation and amortization of property and equipment ....... 256,812 494,430 807,743
Amortization of intangibles and other ........................ 37,000 77,509 159,915
Stock-based compensation ................................. 200,709 458,100 868,646
Excess tax benefits from stock-based award activity .............. 433,724 (581,732) (379,206)
Deferred income taxes ..................................... 21,163 (98,468) (164,212)
Other, net ............................................... 22,040 12,474 (39,741)
Changes in assets and liabilities, net of effects of acquisitions:
Accounts receivable .................................. (372,290) (624,012) (837,247)
Income taxes, net .................................... 66,237 496,882 744,802
Prepaid revenue share, expenses and other assets ........... (51,663) (289,157) (298,689)
Accounts payable .................................... 80,631 95,402 70,135
Accrued expenses and other liabilities .................... 166,764 291,533 418,905
Accrued revenue share ................................ 93,347 139,300 150,310
Deferred revenue .................................... 39,551 30,801 70,329
Net cash provided by operating activities .......................... 2,459,422 3,580,508 5,775,410
Investing activities
Purchases of property and equipment ............................. (838,217) (1,902,798) (2,402,840)
Purchase of marketable securities ................................ (12,675,880) (26,681,891) (15,997,060)
Maturities and sales of marketable securities ....................... 10,257,214 23,107,132 15,659,473
Investments in non-marketable equity securities .................... — (1,019,147) (34,511)
Acquisitions, net of cash acquired and purchases of intangible and other
assets ..................................................... (101,310) (402,446) (906,651)
Net cash used in investing activities .............................. (3,358,193) (6,899,150) (3,681,589)
Financing activities
Net proceeds from stock-based award activity ...................... 85,026 321,117 23,861
Excess tax benefits from stock-based award activity .................. — 581,732 379,206
Net proceeds from public offerings ............................... 4,287,229 2,063,549 —
Payments of principal on capital leases and equipment loans .......... (1,425) — —
Net cash provided by financing activities .......................... 4,370,830 2,966,398 403,067
Effect of exchange rate changes on cash and cash equivalents .......... (21,758) 19,741 40,034
Net increase (decrease) in cash and cash equivalents ................. 3,450,301 (332,503) 2,536,922
Cash and cash equivalents at beginning of year ..................... 426,873 3,877,174 3,544,671
Cash and cash equivalents at end of year ........................... $ 3,877,174 $ 3,544,671 $ 6,081,593
Supplemental disclosures of cash flow information
Cash paid for interest .......................................... $ 216 $ 257 $ 1,336
Cash paid for taxes ............................................ $ 153,628 $ 537,702 $ 882,688
Acquisition related activities:
Issuance of equity in connection with acquisitions, net ............... $ 22,407 $ 1,173,234 $ —
See accompanying notes.
68