Google 2007 Annual Report Download - page 105
Download and view the complete annual report
Please find page 105 of the 2007 Google annual report below. You can navigate through the pages in the report by either clicking on the pages listed below, or by using the keyword search tool below to find specific information within the annual report.-
 1
1 -
2
-
3
-
4
-
5
-
6
-
7
-
8
-
9
-
10
-
11
-
12
-
13
-
14
-
15
-
16
-
17
-
18
-
19
-
20
-
21
-
22
-
23
-
24
-
25
-
26
-
27
-
28
-
29
-
30
-
31
-
32
-
33
-
34
-
35
-
36
-
37
-
38
-
39
-
40
-
41
-
42
-
43
-
44
-
45
-
46
-
47
-
48
-
49
-
50
-
51
-
52
-
53
-
54
-
55
-
56
-
57
-
58
-
59
-
60
-
61
-
62
-
63
-
64
-
65
-
66
-
67
-
68
-
69
-
70
-
71
-
72
-
73
-
74
-
75
-
76
-
77
-
78
-
79
-
80
-
81
-
82
-
83
-
84
-
85
-
86
-
87
-
88
-
89
-
90
-
91
-
92
-
93
-
94
-
 95
95 -
 96
96 -
 97
97 -
 98
98 -
 99
99 -
 100
100 -
 101
101 -
 102
102 -
 103
103 -
 104
104 -
 105
105 -
 106
106 -
 107
107 -
 108
108 -
 109
109 -
 110
110 -
 111
111 -
 112
112 -
 113
113 -
 114
114 -
 115
115 -
116
-
117
-
118
-
119
-
120
-
121
-
122
-
123
-
124
 |
 |

Google Inc.
NOTES TO CONSOLIDATED FINANCIAL STATEMENTS—(Continued)
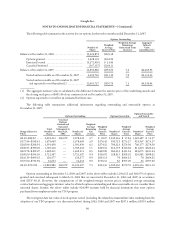
and $635.1 million. The aggregate intrinsic value of all options exercised during 2005, 2006 and 2007 was $1,785.3
million, $1,904.0 million and $1,279.0 million—these amounts do not include the aggregate sales price of options sold
under the TSO program (see below).
In April 2007, we launched our TSO program. Under the TSO program, certain employees are able to sell vested
options granted after our initial public offering under our 2004 Stock Plan to selected financial institutions in an online
auction. All employees may participate in the program other than our executive management group and those who reside
in countries where, due to local legal or tax implications, it would not be beneficial to employees or the TSO program
would be impractical. At the time of sale, the vested option is automatically amended to create a warrant that is exercisable
by the financial institution within two years from the date of issuance. All eligible outstanding options were modified in
the second quarter of 2007 to allow them to be sold under the TSO program and, as a result, we incurred a modification
charge of $95 million during 2007 related to vested options and expect to incur an additional modification charge of
approximately $134 million related to unvested options over their remaining vesting periods through the second quarter
of 2011. The modification charge is equal to the difference between the values of those modified stock options on the date
of modification and their values immediately prior to modification in accordance with SFAS 123R. Further, to the extent
the forfeiture rate is different from what we have anticipated, the modification charge related to the unvested awards will
be different from our expectations. The fair value of each option granted under the TSO program will be greater than it
would have been otherwise because of a longer expected life, resulting in more stock-based compensation per option.
During 2007, the number of shares underlying TSOs sold to selected financial institutions under the TSO program
was 924,399 at a total value of $305.0 million, or an average $329.92 per share, and an average premium of $31.43 per
share. The premium is calculated as the difference between (a) the sale price of the TSO and (b) the intrinsic value of the
TSO, which we define as the excess, if any, of the price of our Class A common stock at the time of the sale over the
exercise price of the TSO. At December 31, 2007, the number of shares underlying TSOs held by financial institutions was
924,399 and the number of options eligible for participation under the TSO program was approximately 8.7 million.
As of December 31, 2007, there was $1,165.1 million of unrecognized compensation cost related to outstanding
employee stock options, net of forecasted forfeitures. This amount is expected to be recognized over a weighted average
period of 2.97 years. To the extent the forfeiture rate is different than what we have anticipated, stock-based compensation
related to these awards will be different from our expectations.
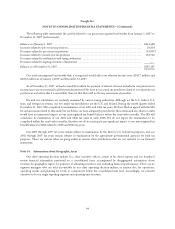
The following table summarizes the activity for our unvested restricted stock units and restricted shares for the
twelve months ended December 31, 2007:
Number of
Shares
Weighted-Average
Grant-Date
Fair Value
Unvested at December 31, 2006 ............................................... 1,771,037 $369.54
Granted ............................................................... 1,870,558 $618.61
Vested ................................................................ (570,863) $362.81
Forfeited .............................................................. (80,510) $396.85
Unvested at December 31, 2007 ............................................... 2,990,222 $526.92
Expected to vest at December 31, 2007 .......................................... 2,795,858 $526.92
As of December 31, 2007, there was $1,332.6 million of unrecognized compensation cost related to employee
unvested restricted stock units and restricted shares, net of forecasted forfeitures. This amount is expected to be
recognized over a weighted average period of 3.42 years. To the extent the actual forfeiture rate is different than what we
have anticipated; stock-based compensation related to these awards will be different from our expectations.
91