Google 2007 Annual Report Download - page 56
Download and view the complete annual report
Please find page 56 of the 2007 Google annual report below. You can navigate through the pages in the report by either clicking on the pages listed below, or by using the keyword search tool below to find specific information within the annual report.-
 1
1 -
2
-
3
-
4
-
5
-
6
-
7
-
8
-
9
-
10
-
11
-
12
-
13
-
14
-
15
-
16
-
17
-
18
-
19
-
20
-
21
-
22
-
23
-
24
-
25
-
26
-
27
-
28
-
29
-
30
-
31
-
32
-
33
-
34
-
35
-
36
-
37
-
38
-
39
-
40
-
41
-
42
-
43
-
44
-
45
-
 46
46 -
 47
47 -
 48
48 -
 49
49 -
 50
50 -
 51
51 -
 52
52 -
 53
53 -
 54
54 -
 55
55 -
 56
56 -
 57
57 -
 58
58 -
 59
59 -
 60
60 -
 61
61 -
 62
62 -
 63
63 -
 64
64 -
 65
65 -
 66
66 -
67
-
68
-
69
-
70
-
71
-
72
-
73
-
74
-
75
-
76
-
77
-
78
-
79
-
80
-
81
-
82
-
83
-
84
-
85
-
86
-
87
-
88
-
89
-
90
-
91
-
92
-
93
-
94
-
95
-
96
-
97
-
98
-
99
-
100
-
101
-
102
-
103
-
104
-
105
-
106
-
107
-
108
-
109
-
110
-
111
-
112
-
113
-
114
-
115
-
116
-
117
-
118
-
119
-
120
-
121
-
122
-
123
-
124
 |
 |

their remaining vesting periods through the second quarter of 2011. In addition, the fair value of each option granted
under the TSO program will be greater than it would have been otherwise because of a longer expected life, resulting in
more stock-based compensation per option. As a result of all of the above, the growth rate of our costs and expenses may
exceed the growth rate of our revenues.
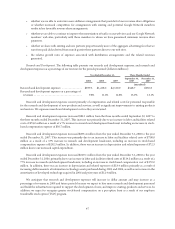
We expect our cost of revenues to continue to increase in dollars and may increase as a percentage of revenues in
2008 and in future periods, primarily as a result of forecasted increases in traffic acquisition costs, data center costs and
credit card and other transaction fees, including transaction processing fees related to Google Checkout, as well as content
acquisition costs. In particular, traffic acquisition costs as a percentage of advertising revenues may increase in the future if
we are unable to continue to improve the monetization of traffic on our web sites and our Google Network members’ web
sites, particularly with those members to whom we have guaranteed minimum revenue share payments.
Our international revenues have grown as a percentage of our total revenues to 48% in 2007 from 43% in 2006. This
increase in the portion of our revenues derived from international markets results largely from increased acceptance of our
advertising programs, increases in our direct sales resources and customer support operations and our continued progress in
developing localized versions of our products in these international markets.
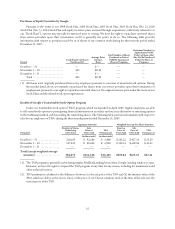
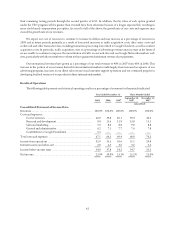
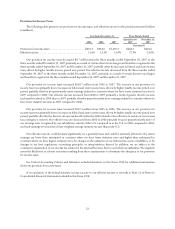
Results of Operations
The following table presents our historical operating results as a percentage of revenues for the periods indicated:
Year Ended December 31, Three Months Ended
2005 2006 2007 September 30,
2007 December 31,
2007
(unaudited)
Consolidated Statement of Income Data:
Revenues ............................................. 100.0% 100.0% 100.0% 100.0% 100.0%
Costs and expenses:
Cost of revenues .................................. 42.0 39.8 40.1 39.3 40.5
Research and development .......................... 9.8 11.6 12.8 13.0 13.1
Sales and marketing ................................ 7.6 8.0 8.8 9.0 8.8
General and administrative .......................... 6.2 7.1 7.7 7.6 7.8
Contribution to Google Foundation .................. 1.5 — — — —
Total costs and expenses ................................ 67.1 66.5 69.4 68.9 70.2
Income from operations ................................. 32.9 33.5 30.6 31.1 29.8
Interest income and other, net ............................ 2.0 4.3 3.6 3.6 3.5
Income before income taxes ............................. 34.9 37.8 34.2 34.7 33.3
Net income ........................................... 23.9% 29.0% 25.3% 25.2% 25.0%
42