Google 2007 Annual Report Download - page 104
Download and view the complete annual report
Please find page 104 of the 2007 Google annual report below. You can navigate through the pages in the report by either clicking on the pages listed below, or by using the keyword search tool below to find specific information within the annual report.-
 1
1 -
2
-
3
-
4
-
5
-
6
-
7
-
8
-
9
-
10
-
11
-
12
-
13
-
14
-
15
-
16
-
17
-
18
-
19
-
20
-
21
-
22
-
23
-
24
-
25
-
26
-
27
-
28
-
29
-
30
-
31
-
32
-
33
-
34
-
35
-
36
-
37
-
38
-
39
-
40
-
41
-
42
-
43
-
44
-
45
-
46
-
47
-
48
-
49
-
50
-
51
-
52
-
53
-
54
-
55
-
56
-
57
-
58
-
59
-
60
-
61
-
62
-
63
-
64
-
65
-
66
-
67
-
68
-
69
-
70
-
71
-
72
-
73
-
74
-
75
-
76
-
77
-
78
-
79
-
80
-
81
-
82
-
83
-
84
-
85
-
86
-
87
-
88
-
89
-
90
-
91
-
92
-
93
-
 94
94 -
 95
95 -
 96
96 -
 97
97 -
 98
98 -
 99
99 -
 100
100 -
 101
101 -
 102
102 -
 103
103 -
 104
104 -
 105
105 -
 106
106 -
 107
107 -
 108
108 -
 109
109 -
 110
110 -
 111
111 -
 112
112 -
 113
113 -
 114
114 -
115
-
116
-
117
-
118
-
119
-
120
-
121
-
122
-
123
-
124
 |
 |

Google Inc.
NOTES TO CONSOLIDATED FINANCIAL STATEMENTS—(Continued)
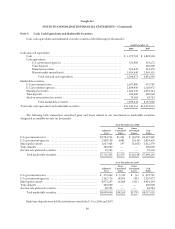
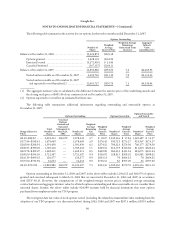
The following table summarizes the activity for our options for the twelve months ended December 31, 2007:
Options Outstanding
Number of
Shares
Weighted-
Average
Exercise Price
Weighted-Average
Remaining
Contractual Term
(in years)
Aggregate
Intrinsic
Value
(in millions)(1)
Balance at December 31, 2006 ...................... 13,424,872 $205.58
Options granted ............................. 3,408,101 $562.95
Exercised/vested ............................ (3,572,930) $ 51.86
Canceled/forfeited .......................... (367,157) $264.11
Balance at December 31, 2007 ...................... 12,892,886 $333.62 7.5 $4,483.92
Vested and exercisable as of December 31, 2007 . . . 4,405,716 $211.10 7.0 $2,116.43
Vested and exercisable as of December 31, 2007
and expected to vest thereafter(2) ............ 12,001,757 $330.70 7.5 $4,330.04
(1) The aggregate intrinsic value is calculated as the difference between the exercise price of the underlying awards and
the closing stock price of $691.48 of our common stock on December 31, 2007.
(2) Options expected to vest reflect an estimated forfeiture rate.
The following table summarizes additional information regarding outstanding and exercisable options at
December 31, 2007:
Options Outstanding Options Exercisable Options Exercisable
and Vested
Range of Exercise
Prices
Total
Number of
Shares
Unvested
Options
Granted and
Exercised
Subsequent to
March 21,
2002 Number of
Shares
Weighted-
Average
Remaining
Life
(Years)
Weighted
Average
Exercise
Price Number of
Shares
Weighted
Average
Exercise
Price Number of
Shares
Weighted
Average
Exercise
Price
$0.30–$85.00 ..... 2,639,312 360,679 2,278,633 5.7 $ 18.07 2,230,265 $ 17.84 1,349,487 $ 15.37
$117.84–$198.41 . . 1,678,669 — 1,678,669 5.9 $176.42 933,713 $175.27 933,367 $175.27
$205.96–$298.91 . . 1,391,439 — 1,391,439 6.5 $274.52 700,523 $274.30 700,177 $274.30
$300.97–$399.00 . . 1,789,518 — 1,789,518 7.1 $329.55 813,173 $326.68 811,819 $326.64
$401.78–$499.07 . . 1,469,211 — 1,469,211 8.5 $449.90 284,533 $431.24 283,671 $431.24
$500.00–$594.05 . . 3,721,507 — 3,721,507 9.4 $556.92 328,015 $508.02 326,881 $508.02
$625.39–$699.35 . . 150,577 — 150,577 9.9 $663.13 78 $664.55 78 $664.55
$707.00–$732.94 . . 52,653 — 52,653 9.9 $718.16 36 $707.00 36 $707.00
$0.30–$732.94 ....12,892,886 360,679 12,532,207 7.5 $333.56 5,290,336 $179.70 4,405,516 $211.10
Options outstanding at December 31, 2006 and 2007 in the above tables include 1,296,155 and 360,679 of options
granted and exercised subsequent to March 21, 2002 that are unvested at December 31, 2006 and 2007, in accordance
with EITF 00-23. However, the computations of the weighted-average exercise prices, weighted average remaining
contractual term and aggregate intrinsic value for all stock options outstanding and those exercisable do not consider these
unvested shares. Further, the above tables include 924,399 warrants held by financial institutions that were options
purchased from employees under our TSO program.
The total grant date fair value of stock options vested (including the related incremental fair value resulting from the
adoption of our TSO program—see discussion below) during 2005, 2006 and 2007 was $287.5 million, $392.9 million
90