Google 2007 Annual Report Download - page 49
Download and view the complete annual report
Please find page 49 of the 2007 Google annual report below. You can navigate through the pages in the report by either clicking on the pages listed below, or by using the keyword search tool below to find specific information within the annual report.-
 1
1 -
2
-
3
-
4
-
5
-
6
-
7
-
8
-
9
-
10
-
11
-
12
-
13
-
14
-
15
-
16
-
17
-
18
-
19
-
20
-
21
-
22
-
23
-
24
-
25
-
26
-
27
-
28
-
29
-
30
-
31
-
32
-
33
-
34
-
35
-
36
-
37
-
38
-
 39
39 -
 40
40 -
 41
41 -
 42
42 -
 43
43 -
 44
44 -
 45
45 -
 46
46 -
 47
47 -
 48
48 -
 49
49 -
 50
50 -
 51
51 -
 52
52 -
 53
53 -
 54
54 -
 55
55 -
 56
56 -
 57
57 -
 58
58 -
 59
59 -
60
-
61
-
62
-
63
-
64
-
65
-
66
-
67
-
68
-
69
-
70
-
71
-
72
-
73
-
74
-
75
-
76
-
77
-
78
-
79
-
80
-
81
-
82
-
83
-
84
-
85
-
86
-
87
-
88
-
89
-
90
-
91
-
92
-
93
-
94
-
95
-
96
-
97
-
98
-
99
-
100
-
101
-
102
-
103
-
104
-
105
-
106
-
107
-
108
-
109
-
110
-
111
-
112
-
113
-
114
-
115
-
116
-
117
-
118
-
119
-
120
-
121
-
122
-
123
-
124
 |
 |

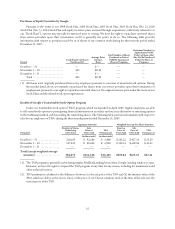
Purchases of Equity Securities by Google
Pursuant to the terms of our 1998 Stock Plan, 2000 Stock Plan, 2003 Stock Plan, 2003 Stock Plan (No. 2), 2003
Stock Plan (No. 3), 2004 Stock Plan and equity incentive plans assumed through acquisitions (collectively referred to as
our “Stock Plans”), options may typically be exercised prior to vesting. We have the right to repurchase unvested shares
from service providers upon their termination, and it is generally our policy to do so. The following table provides
information with respect to purchases made by us of shares of our common stock during the three-month period ended
December 31, 2007:
Period Total Number of Shares
Purchased (1)
Average Price
Paid per
Share
Total Number of Shares
Purchased as Part of
Publicly Announced
Plans or Programs
Maximum Number (or
Approximate Dollar
Value) of Shares that
May Yet Be Purchased
Under the Plans or
Programs
October 1 – 31 ................... — $— — —
November 1 – 30 ................. 401 $0.30 — —
December 1 – 31 ................. — $— — —
Total ...................... 401 $0.30 — —
(1) All shares were originally purchased from us by employees pursuant to exercises of unvested stock options. During
the months listed above, we routinely repurchased the shares from our service providers upon their termination of
employment pursuant to our right to repurchase unvested shares at the original exercise price under the terms of our
Stock Plans and the related stock option agreements.
Results of Google’s Transferable Stock Option Program
Under our transferable stock option (TSO) program, which we launched in April 2007, eligible employees are able
to sell vested stock options to participating financial institutions in an online auction as an alternative to exercising options
in the traditional method and then selling the underlying shares. The following table provides information with respect to
sales by our employees of TSOs during the three-month period ended December 31, 2007:
Aggregate Amounts Weighted-Average Per Share Amounts
Period (1)
Number of Shares
Underlying
TSOs Sold
Sale
Price of
TSOs Sold TSO
Premium (2)
Exercise
Price of
TSOs Sold
Sale
Price of
TSOs Sold TSO
Premium (2)
(in thousands) (in thousands)
October 1 – 31 ................ 216,659 $ 92,586 $ 5,480 $ 262.22 $ 427.33 $ 25.29
November 1 – 30 .............. 167,813 $ 68,642 $ 6,982 $ 330.54 $ 409.04 $ 41.61
December 1 – 31 .............. — — — — — —
Total (except weighted-average
amounts) .................. 384,472 $161,228 $12,462 $292.04 $419.35 $32.41
(1) The TSO program is generally active during regular NASDAQ trading hours when Google’s trading window is open.
However, we have the right to suspend the TSO program at any time for any reason, including for maintenance and
other technical reasons.
(2) TSO premium is calculated as the difference between (a) the sale price of the TSO and (b) the intrinsic value of the
TSO, which we define as the excess, if any, of the price of our Class A common stock at the time of the sale over the
exercise price of the TSO.
35