Google 2007 Annual Report Download - page 58
Download and view the complete annual report
Please find page 58 of the 2007 Google annual report below. You can navigate through the pages in the report by either clicking on the pages listed below, or by using the keyword search tool below to find specific information within the annual report.-
 1
1 -
2
-
3
-
4
-
5
-
6
-
7
-
8
-
9
-
10
-
11
-
12
-
13
-
14
-
15
-
16
-
17
-
18
-
19
-
20
-
21
-
22
-
23
-
24
-
25
-
26
-
27
-
28
-
29
-
30
-
31
-
32
-
33
-
34
-
35
-
36
-
37
-
38
-
39
-
40
-
41
-
42
-
43
-
44
-
45
-
46
-
47
-
 48
48 -
 49
49 -
 50
50 -
 51
51 -
 52
52 -
 53
53 -
 54
54 -
 55
55 -
 56
56 -
 57
57 -
 58
58 -
 59
59 -
 60
60 -
 61
61 -
 62
62 -
 63
63 -
 64
64 -
 65
65 -
 66
66 -
 67
67 -
 68
68 -
69
-
70
-
71
-
72
-
73
-
74
-
75
-
76
-
77
-
78
-
79
-
80
-
81
-
82
-
83
-
84
-
85
-
86
-
87
-
88
-
89
-
90
-
91
-
92
-
93
-
94
-
95
-
96
-
97
-
98
-
99
-
100
-
101
-
102
-
103
-
104
-
105
-
106
-
107
-
108
-
109
-
110
-
111
-
112
-
113
-
114
-
115
-
116
-
117
-
118
-
119
-
120
-
121
-
122
-
123
-
124
 |
 |

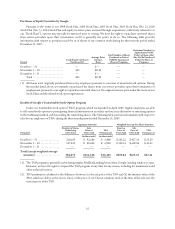
sequential quarterly revenue growth rate from our Google Network members’ web sites increased from 7.6% for the three
months ended September 30, 2007, to 12.5% for the three months ended December 31, 2007. This increase is primarily
the result of increased traffic of certain core partners, substantially due to seasonality, as well as the continued global
expansion of our advertiser base and partner network, partially offset by an improvement to AdSense for content text-
based ads which reduced the number of accidental clicks (see above). The sequential quarterly revenue growth from our
web sites was greater than that from our Google Network members’ web sites primarily as a result of a greater increase in
the total number of paid clicks on our web sites, which was largely due to higher traffic growth and monetization
improvements. We expect that our revenue growth rates will generally decline in the future as a result of increasing
competition and the difficulty of maintaining growth rates as our revenues increase to higher levels.
Aggregate paid clicks on our web sites and our Google Network members’ web sites increased approximately 9%
from the three months ended September 30, 2007 to the three months ended December 31, 2007, approximately 43%
from the year ended 2006 to the year ended 2007 and approximately 65% from the year ended 2005 to the year ended
2006. In general, the increase in paid clicks has historically correlated with increases in our revenues. However, the rate of
increase in paid clicks, and its correlation with the rate of increase in revenues, may fluctuate from quarter to quarter based
on various factors including seasonality, advertiser competition for keywords and the revenue growth rates on our web
sites compared to those of our Google Network members. In addition, traffic growth in emerging markets compared to
more mature markets and across various advertising verticals also contributes to these fluctuations.
We believe that the increase in the number of paid clicks and ads displayed through our programs is substantially the
result of our commitment to improving the relevance and quality of both our search results and the advertisements
displayed, which we believe results in a better user experience, which in turn results in more searches, advertisers, and
Google Network members and other partners. Revenues realized through the Google Print Ads Program, Google Audio
Ads, Google TV Ads, Google Checkout, YouTube, Postini and Search Appliance were not material in any of the periods
presented.
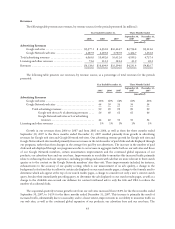
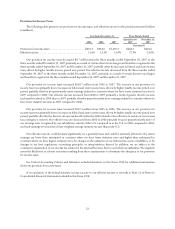
Revenues by Geography
Domestic and international revenues as a percentage of consolidated revenues, determined based on the billing
addresses of our advertisers, are set forth below.
Year Ended December 31, Three Months Ended
2005 2006 2007 September 30,
2007 December 31,
2007
(unaudited)
United States ........................................... 61% 57% 52% 52% 52%
United Kingdom ........................................ 14% 15% 15% 16% 14%
Rest of the world ........................................ 25% 28% 33% 32% 34%
The decrease in the United Kingdom revenues as a percentage of total revenues from the three months ended
September 30, 2007 to the three months ended December 31, 2007 is primarily a result of seasonal slowdown in certain
advertising verticals, such as finance and travel.
The yearly growth in international revenues resulted largely from increased acceptance of our advertising programs
and increases in our direct sales resources and customer support operations in international markets and our continued
progress in developing localized versions of our products for these international markets.
In addition, the weakening of the U.S. dollar relative to other foreign currencies (primarily the euro and the British
pound) in the three and twelve months ended December 31, 2007 compared to the three months ended September 30,
2007 and the twelve months ended December 31, 2006 had a favorable impact on our international revenues, which
increased $295.2 million and $3,321.2 million. Had foreign exchange rates remained constant in these periods, our total
revenues would have been approximately $93.6 million and $542.0 million, or 1.9% and 3.3%, lower.
44