Google 2007 Annual Report Download - page 70
Download and view the complete annual report
Please find page 70 of the 2007 Google annual report below. You can navigate through the pages in the report by either clicking on the pages listed below, or by using the keyword search tool below to find specific information within the annual report.-
 1
1 -
2
-
3
-
4
-
5
-
6
-
7
-
8
-
9
-
10
-
11
-
12
-
13
-
14
-
15
-
16
-
17
-
18
-
19
-
20
-
21
-
22
-
23
-
24
-
25
-
26
-
27
-
28
-
29
-
30
-
31
-
32
-
33
-
34
-
35
-
36
-
37
-
38
-
39
-
40
-
41
-
42
-
43
-
44
-
45
-
46
-
47
-
48
-
49
-
50
-
51
-
52
-
53
-
54
-
55
-
56
-
57
-
58
-
59
-
 60
60 -
 61
61 -
 62
62 -
 63
63 -
 64
64 -
 65
65 -
 66
66 -
 67
67 -
 68
68 -
 69
69 -
 70
70 -
 71
71 -
 72
72 -
 73
73 -
 74
74 -
 75
75 -
 76
76 -
 77
77 -
 78
78 -
 79
79 -
 80
80 -
81
-
82
-
83
-
84
-
85
-
86
-
87
-
88
-
89
-
90
-
91
-
92
-
93
-
94
-
95
-
96
-
97
-
98
-
99
-
100
-
101
-
102
-
103
-
104
-
105
-
106
-
107
-
108
-
109
-
110
-
111
-
112
-
113
-
114
-
115
-
116
-
117
-
118
-
119
-
120
-
121
-
122
-
123
-
124
 |
 |
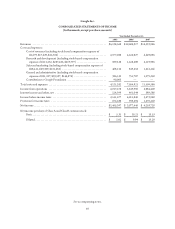
Cash used in investing activities in 2007 of $3,681.6 million was attributable to capital expenditures of $2,402.8
million, cash consideration used in acquisitions and other investments of $941.2 million, of which $545.7 million related
to the acquisition of Postini in the third quarter of 2007, and net purchases of marketable securities of $337.6 million.
Cash used in investing activities in 2006 of $6,899.2 million was attributable to net purchases of marketable
securities of $3,574.8 million primarily driven by the additional cash raised from our follow-on public stock offering in
April 2006, cash consideration used in acquisitions and other investments of $1,421.6 million primarily related to our $1.0
billion investment in America Online, Inc. and to a lesser extent, the acquisition of dMarc Broadcasting, Inc. and capital
expenditures of $1,902.8 million.
Cash used in investing activities in 2005 of $3,358.2 million was attributable to net purchases of marketable
securities of $2,418.7 million, capital expenditures of $838.2 million and cash consideration used in acquisitions and other
investments of $101.3 million, net of cash acquired. Capital expenditures are mainly for the purchase of information
technology assets. In order to manage expected increases in internet traffic, advertising transactions and new products and
services, and to support our overall global business expansion, we will continue to invest heavily in data center operations,
technology, corporate facilities and information technology infrastructure in 2008 and thereafter.
In addition, we expect to spend a significant amount of cash on acquisitions and other investments from time to time.
These acquisitions generally enhance the breadth and depth of our expertise in engineering and other functional areas, our
technologies and our product offerings. In April 2007, we entered into an Agreement and Plan of Merger to acquire
DoubleClick, a privately held company, for approximately $3.1 billion in cash. See Note 7 of Notes to Consolidated
Financial Statements included as part of this Form 10-K for additional information on the pending DoubleClick
acquisition.
In connection with certain acquisitions, we are obligated to make additional cash payments if certain criteria are met.
As of December 31, 2007, our remaining contingent obligations related to these acquisitions was approximately $800
million. Since these contingent payments are based on the achievement of performance targets, actual payments may be
substantially lower.
Also, as part of our philanthropic program, we expect to make donations as well as investments in for-profit
enterprises that aim to alleviate poverty, improve the environment or achieve other socially or economically progressive
objectives. We expect these payments to be made primarily in cash and to be approximately $175 million over the three
years ending December 31, 2008, with any unallocated amounts to be rolled over into the following year.
Cash provided by financing activities in 2007 of $403.1 million was due primarily to (i) excess tax benefits of $379.2
million from stock-based award activity during the period and (ii) net proceeds from the issuance of common stock
pursuant to stock-based award activity of $23.9 million. As a result of our TSO program, proceeds from the exercise of
stock options will be deferred and may be less than we would have received had we not adopted the TSO program. This is
because the financial institutions that purchase TSOs will likely not exercise the related warrants until the expiration of the
contractual term from the date of purchase (generally, two years), and then only if the market value exceeds the exercise
price on the expiration date. Cash provided by financing activities in 2006 of $2,966.4 million was due primarily to (i) net
proceeds of $2,063.5 million raised from the follow-on stock offering, (ii) excess tax benefits of $581.7 million from
stock-based award activity during the period and (iii) net proceeds from the issuance of common stock pursuant to stock-
based award activity of $321.1 million. Cash provided by financing activities in 2005 of $4,370.8 million was due primarily
to net proceeds from our follow-on stock offering of $4,287.2 million, after consideration of related issuance costs of $66.8
million.
56