Google 2007 Annual Report Download - page 62
Download and view the complete annual report
Please find page 62 of the 2007 Google annual report below. You can navigate through the pages in the report by either clicking on the pages listed below, or by using the keyword search tool below to find specific information within the annual report.-
 1
1 -
2
-
3
-
4
-
5
-
6
-
7
-
8
-
9
-
10
-
11
-
12
-
13
-
14
-
15
-
16
-
17
-
18
-
19
-
20
-
21
-
22
-
23
-
24
-
25
-
26
-
27
-
28
-
29
-
30
-
31
-
32
-
33
-
34
-
35
-
36
-
37
-
38
-
39
-
40
-
41
-
42
-
43
-
44
-
45
-
46
-
47
-
48
-
49
-
50
-
51
-
 52
52 -
 53
53 -
 54
54 -
 55
55 -
 56
56 -
 57
57 -
 58
58 -
 59
59 -
 60
60 -
 61
61 -
 62
62 -
 63
63 -
 64
64 -
 65
65 -
 66
66 -
 67
67 -
 68
68 -
 69
69 -
 70
70 -
 71
71 -
 72
72 -
73
-
74
-
75
-
76
-
77
-
78
-
79
-
80
-
81
-
82
-
83
-
84
-
85
-
86
-
87
-
88
-
89
-
90
-
91
-
92
-
93
-
94
-
95
-
96
-
97
-
98
-
99
-
100
-
101
-
102
-
103
-
104
-
105
-
106
-
107
-
108
-
109
-
110
-
111
-
112
-
113
-
114
-
115
-
116
-
117
-
118
-
119
-
120
-
121
-
122
-
123
-
124
 |
 |

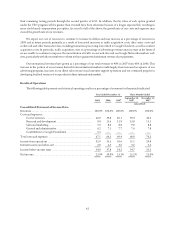
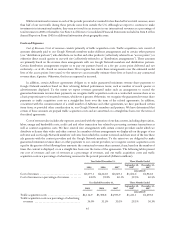
Sales and Marketing. The following table presents our sales and marketing expenses, and sales and marketing
expenses as a percentage of revenues for the periods presented (dollars in millions):
Year Ended December 31, Three Months Ended
2005 2006 2007 September 30,
2007 December 31,
2007
(unaudited)
Sales and marketing expenses ....................... $468.2 $849.5 $1,461.3 $380.8 $422.3
Sales and marketing expenses as a percentage of
revenues ..................................... 7.6% 8.0% 8.8% 9.0% 8.8%
Sales and marketing expenses consist primarily of compensation and related costs for personnel engaged in customer
service and sales and sales support functions, as well as promotional and advertising expenditures.
Sales and marketing expenses increased $41.5 million from the three months ended September 30, 2007 to the three
months ended December 31, 2007. This increase was primarily due to an increase in labor and facilities related costs of
$43.6 million mostly as a result of an increase in certain bonuses and a 3% increase in sales and marketing headcount,
including an increase in stock-based compensation expense of $8.2 million, partially offset by a decrease in advertising and
promotional expense of $3.9 million.
Sales and marketing expenses increased $611.8 million from the year ended December 31, 2006 to the year ended
December 31, 2007. This increase was primarily due to an increase in labor and facilities related costs of $435.7 million
mostly as a result of a 52% increase in sales and marketing headcount, including an increase in stock-based compensation
expense of $72.2 million, and an increase in depreciation and related expense of $74.2 million due to our increased capital
expenditures. In addition, there was an increase in promotional and advertising expense of $37.5 million and an increase in
travel and entertainment expense of $28.9 million.
Sales and marketing expenses increased $381.3 million from the year ended December 31, 2005 to the year ended
December 31, 2006. This increase was primarily due to an increase in labor and facilities related costs of $240.1 million
mostly as a result of an 88% increase in sales and marketing headcount, including an increase in stock-based compensation
of $31.0 million, an increase in promotional and advertising expenses of $83.5 million and an increase in depreciation and
related expenses of $21.6 million.
We anticipate sales and marketing expenses will continue to increase in dollar amount and may increase as a
percentage of revenues in 2008 and future periods as we continue to expand our business on a worldwide basis. A
significant portion of these increases relate to our plan to hire additional personnel and increase advertising and
promotional expenditures to increase the level of service we provide to our advertisers and Google Network members. We
also plan to add a significant number of international sales personnel to support our worldwide expansion. In addition, we
expect greater stock-based compensation expenses on a per option basis as a result of our TSO program.
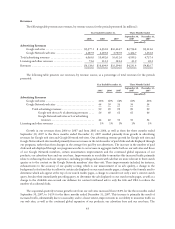
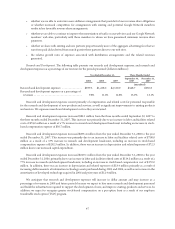
General and Administrative. The following table presents our general and administrative expenses, and general and
administrative expenses as a percentage of revenues for the periods presented (dollars in millions):
Year Ended December 31, Three Months Ended
2005 2006 2007 September 30,
2007 December 31,
2007
(unaudited)
General and administrative expenses ................. $386.5 $751.8 $1,279.3 $321.4 $377.0
General and administrative expenses as a percentage of
revenues ..................................... 6.2% 7.1% 7.7% 7.6% 7.8%
General and administrative expenses consist primarily of compensation and related costs for personnel and facilities
related to our finance, human resources, facilities, information technology and legal organizations, and fees for
professional services. Professional services are principally comprised of outside legal, audit, information technology
consulting and outsourcing services.
48