Frontier Communications 2005 Annual Report Download - page 86
Download and view the complete annual report
Please find page 86 of the 2005 Frontier Communications annual report below. You can navigate through the pages in the report by either clicking on the pages listed below, or by using the keyword search tool below to find specific information within the annual report.-
 1
1 -
2
-
3
-
4
-
5
-
6
-
7
-
8
-
9
-
10
-
11
-
12
-
13
-
14
-
15
-
16
-
17
-
18
-
19
-
20
-
21
-
22
-
23
-
24
-
25
-
26
-
27
-
28
-
29
-
30
-
31
-
32
-
33
-
34
-
35
-
36
-
37
-
38
-
39
-
40
-
41
-
42
-
43
-
44
-
45
-
46
-
47
-
48
-
49
-
50
-
51
-
52
-
53
-
54
-
55
-
56
-
57
-
58
-
59
-
60
-
61
-
62
-
63
-
64
-
65
-
66
-
67
-
68
-
69
-
70
-
71
-
72
-
73
-
74
-
75
-
 76
76 -
 77
77 -
 78
78 -
 79
79 -
 80
80 -
 81
81 -
 82
82 -
 83
83 -
 84
84 -
 85
85 -
 86
86 -
 87
87 -
 88
88 -
 89
89 -
 90
90 -
 91
91 -
 92
92 -
 93
93 -
 94
94 -
 95
95 -
 96
96
 |
 |

F-37
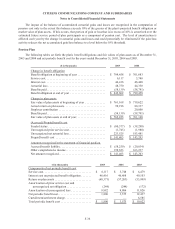
CITIZENS COMMUNICATIONS COMPANY AND SUBSIDIARIES
Notes to Consolidated Financial Statements
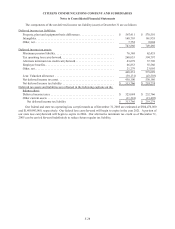
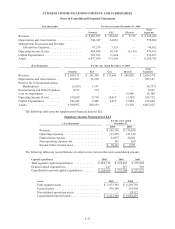
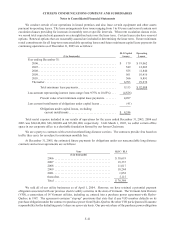
The plan’s weighted average asset allocations at December 31, 2005 and 2004 by asset category are as
follows:
2005 2004
Asset category:
Equity securities . . . . . . . . . . . . . . . . . . . . . . . . . . 50% 57%
Debt securities . . . . . . . . . . . . . . . . . . . . . . . . . . . . 34% 32%
Alternative investments . . . . . . . . . . . . . . . . . . . . 13% 8%
Cash and other . . . . . . . . . . . . . . . . . . . . . . . . . . . . 3% 3%
Total . . . . . . . . . . . . . . . . . . . . . . . . . . . . . . . . . 100% 100%
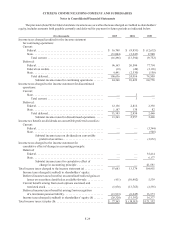
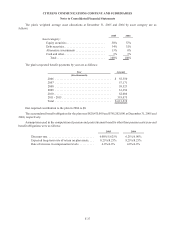
The plan’s expected benefit payments by year are as follows:
Year Amount
($ in thousands)
2006 . . . . . . . . . . . . . . . . . . . . . . . . . . . . . . . . . . . . . . $ 55,350
2007 . . . . . . . . . . . . . . . . . . . . . . . . . . . . . . . . . . . . . . 57,171
2008 . . . . . . . . . . . . . . . . . . . . . . . . . . . . . . . . . . . . . . 58,523
2009 . . . . . . . . . . . . . . . . . . . . . . . . . . . . . . . . . . . . . . 61,394
2010 . . . . . . . . . . . . . . . . . . . . . . . . . . . . . . . . . . . . . . . 62,006
2011 - 2015 . . . . . . . . . . . . . . . . . . . . . . . . . . . . . . . . . 319,075
Total . . . . . . . . . . . . . . . . . . . . . . . . . . . . . . . . . . . . . . $ 613,519
Our required contribution to the plan in 2006 is $0.
The accumulated benefit obligation for the plan was $820,475,000 and $781,202,000 at December 31, 2005 and
2004, respectively.
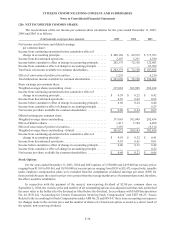
Assumptions used in the computation of pension and postretirement benefits other than pension costs/year-end
benefit obligations were as follows:
2005 2004
Discount rate . . . . . . . . . . . . . . . . . . . . . . . . . . . . . . . . 6.00%/5.625% 6.25%/6.00%
Expected long-term rate of return on plan assets . . . . 8.25%/8.25% 8.25%/8.25%
Rate of increase in compensation levels. . . . . . . . . . . 4.0%/4.0% 4.0%/4.0%